
- Title
-
Self-organising aggregates of zebrafish retinal cells for investigating mechanisms of neural lamination
- Authors
- Eldred, M.K., Charlton-Perkins, M., Muresan, L., Harris, W.A.
- Source
- Full text @ Development
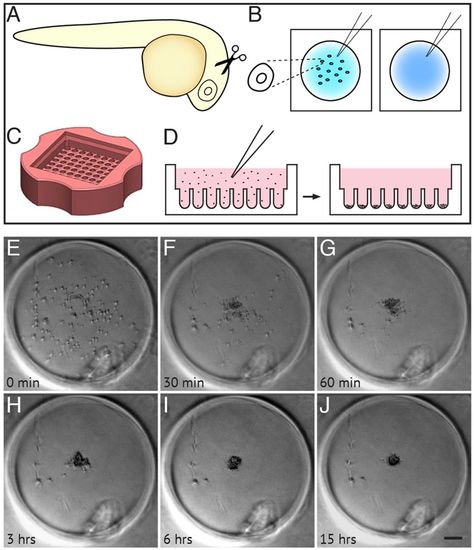
Dissociation, culture and re-aggregation of zebrafish retinal cells. (A,B) Schematic representing retinas dissected from 24 hpf zebrafish (A), collected into glass dishes and dissociated into single cells (B). (C) Agarose microwell dish cast from the 3D Petri Dish PDMS Mould (adapted, with permission, from http://www.microtissues.com). (D) Schematic representing the seeding chamber of the 3D Petri dish. After seeding, cells settle into individual wells. (E-J) Time-lapse images of a single well from the 3D Petri dish showing 24 hpf cells re-aggregating. (H) Cells are almost fully reaggregated 3 h after seeding. (J) Cells have undergone compaction 15 h after seeding. Time is in minutes and hours after seeding. Scale bar: 100 μm. |
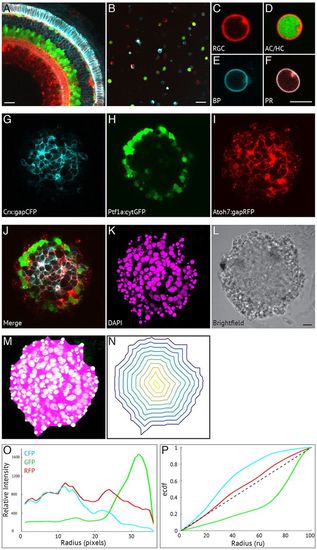
A self-organising retina: identification of zebrafish retinal cells and characterisation of organisation. The main cell types of the retina can be identified in the SoFa1 transgenic line (Almeida et al., 2014) using a combination of genetically tagged cell fate markers: Atoh7:gapRFP labels RGC, AC/HC and PR cell membranes; Ptf1a:cytGFP labels AC/HC cytoplasm; and Crx:gapCFP labels BP and PR membranes. (A) Central sagittal section of a region of the SoFa1 retina. Scale bar: 20 μm. (B) Dissociated cells of the SoFa1 line. Scale bar: 20 μm. (C-F) Individual cells are identified based on their spectral expression: (C) RGCs express membrane RFP; (D) AC/HCs express cytoplasmic GFP and membrane RFP; (E) BPs express membrane CFP; and (F) PRs express membrane CFP and RFP. Scale bar: 5 μm. (G-L) Central sagittal section of a retinal aggregate cultured using the SoFa1 line. (G) Crx:gapCFP-expressing cells are found in the centre of the aggregate. (H) Ptf1a:cytGFP-expressing cells are found in a distinct ring around the Crx:gapCFP population. (I) Atoh7:gapRFP-expressing cells are found throughout the aggregate. (J) Merge of channels represented in G-I. (K) DAPI. (L) Bright-field image. Scale bar: 10 μm. (M-P) Generation of analysis of cellular organisation using custom-made Matlab scripts. (M) A mask is fitted to the aggregate using the DAPI channel. (N) Successive isocontours are fitted from the periphery to the centre of the aggregate. (O) Fluorescence is measured along each contour and plotted as a relative fluorescence intensity (y-axis) against radial position (in pixels) (x-axis). (P) Fluorescence profiles for each channel are plotted as an empirical cumulative distribution function (ECDF) (y-axis) against radial position [radial units (ru)] (x-axis). The dotted diagonal line represents a theoretically perfect even distribution of fluorescence from centre to periphery. |
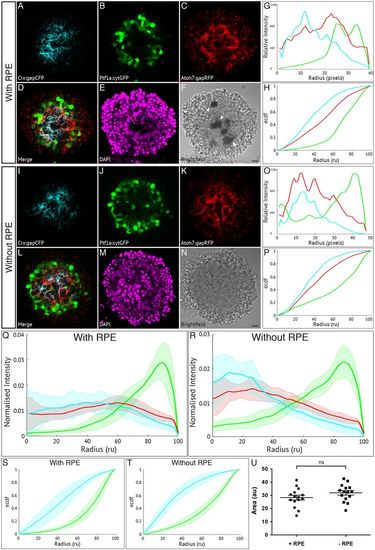
Retinal pigment epithelium is not required for zebrafish retinal self-organisation. Fluorescence profiles are generated for SoFa1 aggregates cultured either with or without RPE cells. (A-F) Central sagittal section of a SoFa1 aggregate with RPE. (A) Crx:gapCFP-expressing cells are found in the centre of the aggregate. (B) Ptf1a:cytGFP-expressing cells are found in a ring around the edge of the Crx:gapCFP population. (C) Atoh7:gapRFP-expressing cells are found throughout the aggregate. (D) Merge of channels represented in (A-C). (E) DAPI. (F) Bright-field image. Pigment-expressing RPE cells can be seen near the centre of the aggregate (arrows). Scale bar: 10 μm. (G) Fluorescence profiles for the aggregate represented in A-F. (H) ECDF plot for the aggregate represented in A-F. (I-N) Central sagittal section of a SoFa1 aggregate without RPE. (I) Crx:gapCFP-expressing cells are found in the centre of the aggregate. (J) Ptf1a:cytGFP-expressing cells are found in a ring around the edge of the Crx:gapCFP population. (K) Atoh7:gapRFP-expressing cells are found throughout the aggregate. (L) Merge of channels represented in I-K. (M) DAPI. (N) Bright-field image. No pigment-expressing RPE cells can be seen. Scale bar: 10 μm. (O) Fluorescence profiles for the aggregate represented in I-N. (P) ECDF plot for the aggregate represented in I-N. (Q) Average fluorescence profiles with shaded error for aggregates with RPE (n=15, three experimental repeats). (R) Average fluorescence profiles with shaded error for aggregates without RPE (n=15, three experimental repeats). (S) Average ECDF plots for aggregates with RPE. (T) Average ECDF plots for aggregates without RPE. (U) Area (in arbitrary units) is calculated between the ECDF for the Crx:gapCFP population and the ECDF for the Ptf1a:cytGFP population of cells, and compared between aggregates with RPE (+RPE) and without RPE (–RPE) (n=15 for each condition, Mann–Whitney two-tailed t-test, P>0.05). |
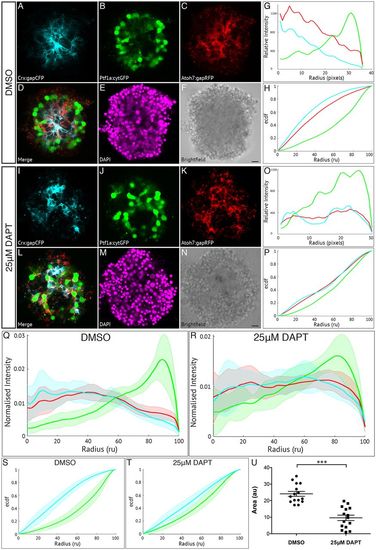
Müller glia are important in zebrafish retinal self-organisation. Fluorescence profiles are generated for SoFa1 aggregates treated either with 25 μM DAPT to prevent the differentiation of Müller glia or with DMSO as a control. (A-F) Central sagittal section of a SoFa1 aggregate treated with DMSO. (A) Crx:gapCFP-expressing cells are found in the centre of the aggregate. (B) Ptf1a:cytGFP-expressing cells are found in a ring around the edge of the Crx:gapCFP population. (C) Atoh7:gapRFP-expressing cells are found throughout the aggregate. (D) Merge of channels represented in A-C. (E) DAPI. (F) Bright-field image. Scale bar: 10 μm. (G) Fluorescence profiles for the aggregate represented in A-F. (H) ECDF plot for the aggregate represented in A-F. (I-N) Central sagittal section of a SoFa1 aggregate treated with 25 μM DAPT. (I) Some Crx:gapCFP-expressing cells are found in the centre of the aggregate, and some are found nearer the edge. (J) Ptf1a:cytGFP-expressing cells are found throughout the aggregate. (K) Atoh7:gapRFP-expressing cells are found throughout the aggregate. (L) Merge of channels presented in I-K. (M) DAPI. (N) Bright-field image. Scale bar: 10 μm. (O) Fluorescence profiles for the aggregate represented in I-N. (P) ECDF plot for the aggregate represented in I-N. (Q) Average fluorescence profiles with shaded error for aggregates treated with DMSO (n=15, three experimental repeats). (R) Average fluorescence profiles with shaded error for aggregates treated with 25 μM DAPT (n=15, three experimental repeats). (S) Average ECDF plots for aggregates treated with DMSO. (T) Average ECDF plots for aggregates treated with 25 μM DAPT. (U) Area (in arbitrary units) is calculated between the ECDF for the Crx:gapCFP population and the ECDF for the Ptf1a:cytGFP population of cells, and compared between aggregates treated with DMSO and aggregates treated with 25 μM DAPT (n=15 for each condition, Mann–Whitney two-tailed t-test, P<0.0001). |
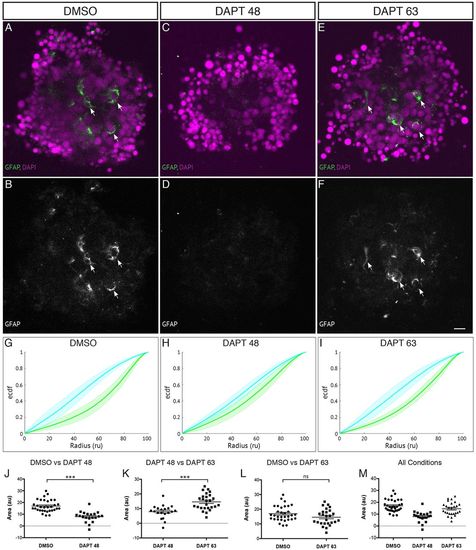
Late application of DAPT allows Müller glia to be generated and aggregates to self-organise. Aggregates are cultured in the presence of DAPT applied at 45-48 hpf onwards to block the differentiation of Müller glia or at 63 hpf onwards to allow the differentiation of some Müller glia compared with DMSO control. (A,B) Aggregates cultured in the presence of DMSO show several GFAP-positive cells (indicated by arrows). (C,D) Aggregates cultured in the presence of DAPT from 45-48 hpf onwards have little or no GFAP-positive cells. (E,F) Aggregates cultured in the presence of DAPT from 63 hpf onwards have several GFAP-positive cells (indicated by arrows). Scale bar: 10μm. (G) Average ECDF plots for aggregates treated with DMSO. (H) Average ECDF plots for aggregates treated with DAPT from 45-48 hpf onwards. (I) Average ECDF plots for aggregates treated with DAPT from 63 hpf onwards. (J) Area (in arbitrary units) is calculated between the ECDF for the Crx:gapCFP population and the ECDF for the Ptf1a:cytGFP population of cells, and compared between aggregates treated with DMSO and aggregates treated with DAPT from 45-48 hpf onwards (n=32 for DMSO, n=20 for DAPT at 45-48 hpf, Mann–Whitney two-tailed t-test, P<0.0001). (K) Area (arbitrary units) compared between the ECDF plots of aggregates treated with DAPT from 45-48 hpf onwards and aggregates treated with DAPT from 63 hpf onwards (n=20 for DAPT at 45-48 hpf, n=26 for DAPT at 63 hpf, Mann–Whitney two-tailed t-test, P<0.0001). (L) Area (arbitrary units) compared between the ECDF plots of aggregates treated with DMSO and aggregates treated with DAPT from 63 hpf onwards (n=32 for DMSO, n=26 for DAPT at 63 hpf, Mann–Whitney two-tailed t-test, P>0.05). (M) Areas of data from all conditions. |
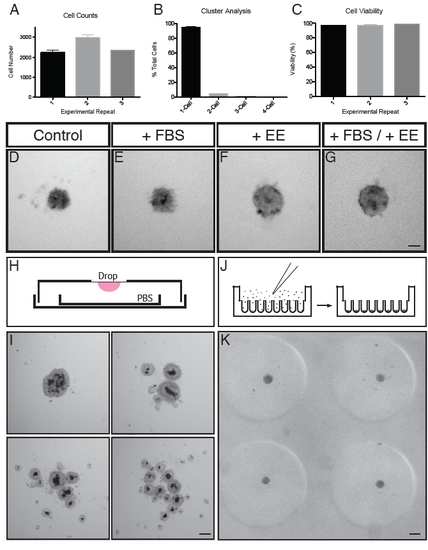
Optimisation of Dissociation and Culture of Embryonic Zebrafish Retinal Cells in 3D Format. (A) Cell counts for 3 experimental repeats (n = 3 for each). (B) Cluster analysis for the same experiments as in (A) (n = 9). (C) Percentage cell viability for the same 3 experimental repeats as in (A,B). (D-G) Comparison of cells cultured in the absence or presence of various supplements. (D) Cells cultured in control conditions (L-15 + PSF). (E) Cells cultured in control conditions and supplemented with FBS (+FBS). (F) Cells cultured in control conditions and supplemented with embryo extract (+EE). (G) Cells cultured in control conditions and supplemented with FBS and embryo extract (+FBS/ +EE). Scale bar = 50μm. (H) Schematic representing the hanging drop setup. Cells were seeded on the coverslip of a culture dish and inverted. A smaller dish containing PBS was placed inside to maintain a humid environment to prevent the drop drying out. (I) Representative examples of aggregates produced using the hanging drop method. Note the varying degrees of aggregation, some generating 1 whole aggregate, and others generating multiple smaller aggregates. Scale bar = 100μm. (J) Schematic representing the seeding chamber of the 3D Petri dish. After seeding, cells settle into individual wells. (K) A representative example of 4 wells of a culture in an agarose microwell dish cast from the 3D Petri Dish PDMS mould. Note the consistent size and shape of each aggregate. Scale bar = 100μm. |
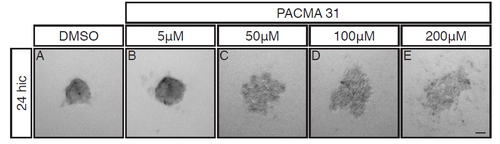
R-Cognin is important for embryonic zebrafish retinal cell re-aggregation after dissociation. 24hpf cells after 24 hours in culture (24hic). Cells were treated with either (A) DMSO or (B) 5μM (C) 50μM (D) 100μM or (E) 200μM of PACMA 31, a small molecule inhibitor of R-Cognin. Cells cultured in 5μM PACMA31 (B) generated slightly looser aggregates. Cells cultured with 50μM - 200μM (C-E) PACMA31 were completely unable to aggregate. Scale bar = 50μm. |
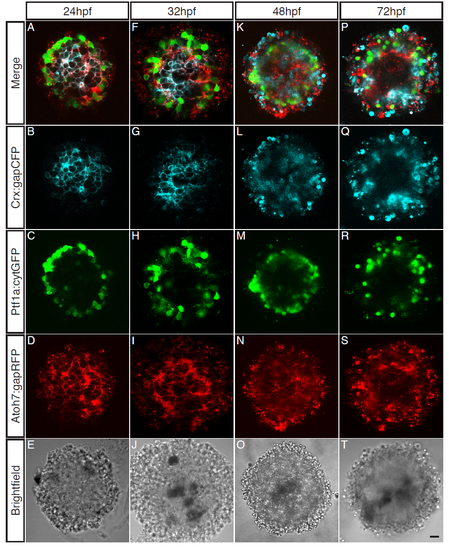
Cells cultured from younger embryonic zebrafish stages are most capable of organising. Cells from varying embryonic stage zebrafish (24hpf – 72hpf) cultured for 48 hours. (AE) Central sagittal section of a SoFa1 aggregate cultured from 24hpf cells. (A) Merge of all channels. (B) Crx:gapCFP expressing cells are found in the centre of the aggregate. (C) Ptf1a:cytGFP expressing cells are found in a distinct ring around the outside of the aggregate. (D) Atoh7:gapRFP expressing cells are found throughout the aggregate. (E) Brightfield. (F-J) Central sagittal section of a SoFa1 aggregate cultured from 32hpf cells. (F) Merge of all channels. (G) Crx:gapCFP expressing cells are found in the centre of the aggregate. (H) Ptf1a:cytGFP expressing cells are found in a distinct ring around the outside of the aggregate. (I) Atoh7:gapRFP expressing cells are found throughout the aggregate. (J) Brightfield. (K-O) Central sagittal section of a SoFa1 aggregate cultured from 48hpf cells. (K) Merge of all channels. (L) Crx:gapCFP expressing cells are found throughout the aggregate. (M) Ptf1a:cytGFP expressing cells are found in a ring around the outside of the aggregate. (N) Atoh7:gapRFP expressing cells are found throughout the aggregate. (O) Brightfield. (P-T) Central sagittal section of a SoFa1 aggregate cultured from 72hpf cells. (P) Merge of all channels. (Q) Crx:gapCFP expressing cells are found towards the outside of the aggregate. (R) Ptf1a:cytGFP expressing cells are found in a ring around the outside of the aggregate. (S) Atoh7:gapRFP expressing cells are found throughout the aggregate. (T) Brightfield. Scale bar = 10μm. |
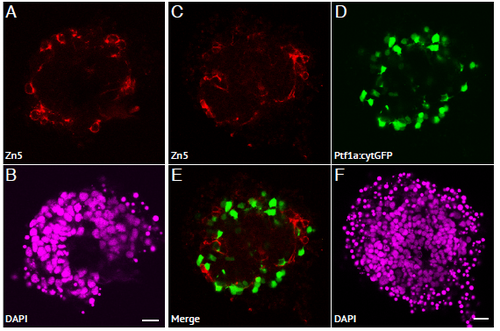
RGC cells are positioned in the outer layer of zebrafish retinal aggregates. (A-B) Aggregates cultured using the WT zebrafish strain, and stained with Zn5 primary antibody (marking RGCs) and DAPI. (A) RGCs can be seen positioned in the outer layer of the aggregate, and are extending axonal projections into the aggregate (arrows). (B) DAPI. Scale bar = 10μm. (C-F) Aggregates cultured using the Ptf1a:cytGFP zebrafish line, and stained with Zn5 primary antibody (marking RGCs) and DAPI. (C) RGCs can be seen positioned in the outer layer of the aggregate, and are extending axonal projections into the aggregate (arrows). (D) Ptf1a:cytGFP cells (namely ACs) are positioned in a ring around the outside of the aggregate. (E) Merge of (C and D) showing Zn5+ RGCs positioned in the outer layer, amongst the Ptf1a:cytGFP expressing cells. (F) DAPI. Scale bar = 10μm. |
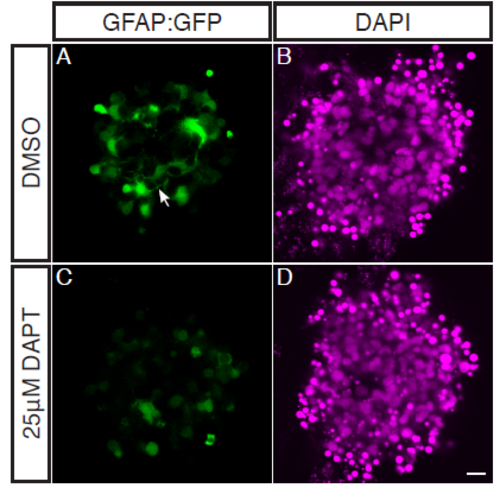
Müller Glia are absent in aggregates treated with 25μM DAPT. Zebrafish retinal cells were cultured using the GFAP:GFP transgenic line which strongly labels Müller Glia (but is also expressed in undifferentiated cells at low levels). Aggregates were treated with either DMSO or 25μM DAPT from the equivalent of 45hpf onwards. (A-B) Aggregates treated with DMSO as a control. (A) GFAP:GFP expressing MG can be seen throughout the aggregate, extending axonal like projections into the aggregate (filled arrow). (B) DAPI. (C-D) Aggregates treated with 25μM DAPT. (C) GFAP:GFP can only be seen at low levels, and no axonal projections can be seen indicating a lack of MG present. (D) DAPI. Scale bar = 10μm. |
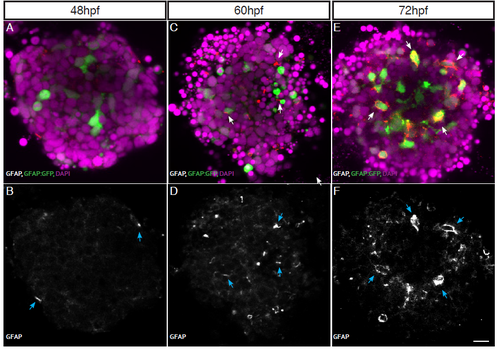
Müller Glia development is similar in aggregates as in vivo. (A-B) GFAP expression starts to be seen in very few cells at 48hpf. (C-D) As Müller cells mature GFAP is expressed in more cells by 60hpf. (E-F) By 72hpf GFAP expression is seen in most, if not all, mature Müller cells. GFAP positive cells indicated with arrows. Scale bar = 10μm. |