
- Title
-
ptf1a+ , ela3l- cells are developmentally maintained progenitors for exocrine regeneration following extreme loss of acinar cells in zebrafish larvae.
- Authors
- Schmitner, N., Kohno, K., Meyer, D.
- Source
- Full text @ Dis. Model. Mech.
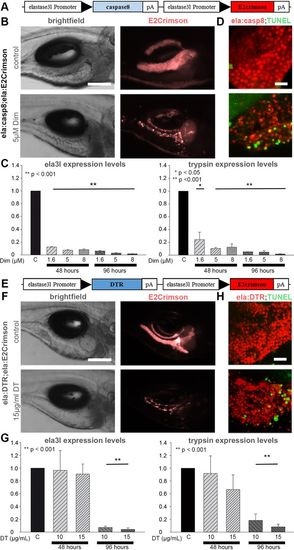
Exocrine-tissue-specific zebrafish cell ablation systems. (A) Construct used to generate ela:casp8 transgenics (black arrowheads indicate promoter direction). (B) Brightfield and epifluorescence images of 7 dpf larvae showing E2Crimson signals in untreated control animals and after ablation with 5 µM Dim for 48 h. (C) Relative expression levels of ela3l (left) and trypsin (right) mRNA as revealed by qPCR analyses of whole-embryo RNA preparations of control larvae and larvae treated with 1.6, 5 and 8 µM Dim for 48 and 96 h, normalized to β-actin levels. (D) Confocal projection of untreated 5 dpf larva and larva treated for 8 h with 5 µM Dim labelled by TUNEL staining (green). (E) Construct used to generate the ela:DTR transgenics. (F) Brightfield and epifluorescence images of 9 dpf untreated larvae showing exocrine-specific expression of E2Crimson and strongly reduced expression of E2Crimson after incubation in 15 µg/ml DT for 96 h. (G) Relative expression levels of ela3l (left) and trypsin (right) mRNA as revealed by qPCR analyses of whole-embryo RNA preparations of control larvae and larvae treated with 10 and 15 µg/ml DT for 48 and 96 h, normalized to β-actin levels. (H) Confocal projection of untreated 7 dpf larva and larva treated for 72 h with 15 µg/ml DT labeled by TUNEL staining (green). Values are mean+s.e.m. of n=5 embryos per sample and >3 biological replicates. Scale bars: 150 µm (B,F) and 20 µm (D,H). |
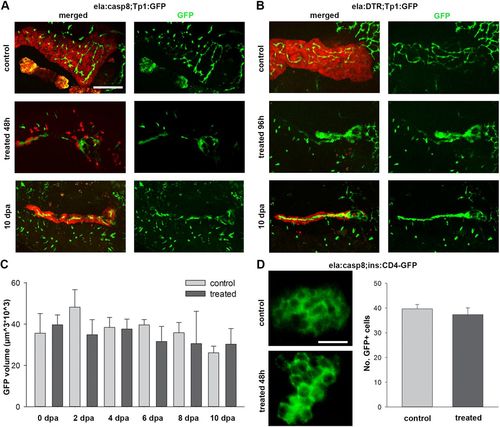
Ablation of exocrine cells does not affect neighboring NRCs and β-cells. (A,B) Confocal image projections of ela:casp8;Tp1:eGFP (A) and ela:DTR;Tp1:eGFP (B) in untreated control animals (7 dpf for ela:casp8 and 9 dpf for ela:DTR), animals directly after treatment and 10 dpf animals. Note that newly established exocrine cells are found next to NRCs. (C) Volume of pancreatic NRCs, determined by GFP expression, is not significantly changed after ablation and during regeneration of exocrine cells in ela:casp8 embryos (n>5 larva for each time point). (D) β-cells labeled using Tg(ins:CD4-eGFP). The number of β-cells was unaffected by treatment with dimerizer (n=6). Values are mean+s.e.m. Scale bars: 100 µm (A,B) and 20 µm (D). |
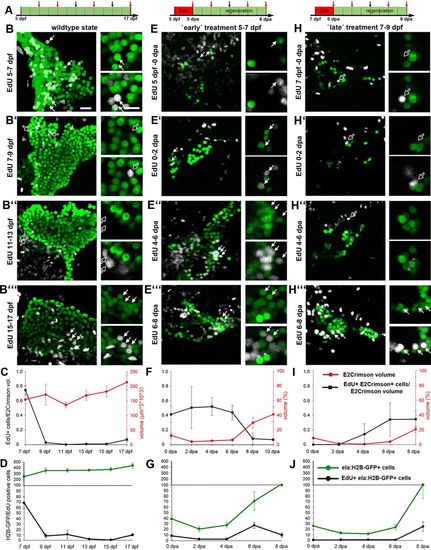
Dynamics of exocrine development and regeneration. (A) Time scheme of regeneration experiments indicating phase with Dim treatment (in red) and time points of fixation (arrows). (B,E,H) Confocal images of Tg(ela:casp8;ela:H2B-GFP) animals at different stages of larval development (stages as indicated by red arrows in A). All larvae were treated with EdU for 48 h before fixation (GFP signals in green, EdU signals in white, smaller white dots correspond to E2Crimson background). Images cover the pancreatic head region of untreated (B-B′″) animals and of larvae treated with 5 µM Dim either from 5 to 7 dpf (E-E″′, ‘early’ treatment) or from 7 to 9 dpf (H-H′″, ‘late’ treatment). Shown are projections and selections of single plane images (smaller images to the right). Note that ‘late’ treatment larva between 0-6 dpa lack EdU+ GFP+ cells (white arrows) and that EdU+ signals in 9 dpf and 13 dpf control animals (B′,B″) and in 0-6 dpa late treatment larvae (H-H″) localized to GFP-negative nuclei (black arrows). (C,D,F,G,I,J) Data quantification (n>5 larva for each time point; mean+s.e.m.) using volumetric measurements (C,F,I) and cell counts (D,G,J: absolute numbers of nuclei per stack) for control larva (C,D), early treatment larvae (F,G) and late treatment larvae (I,J). Red line in C shows the absolute E2Crimson volume (in red), whereas in F and I, it shows the relative volume compared with the wild-type situation as shown in C. Note that different samples were analyzed in E-G and H-J, and that the higher proliferation rate in 11 dpf control animals shown in D compared with C result from only two larvae with 10 and 40 EdU+ cells (see Table S1). Scale bars: 20 µm. |
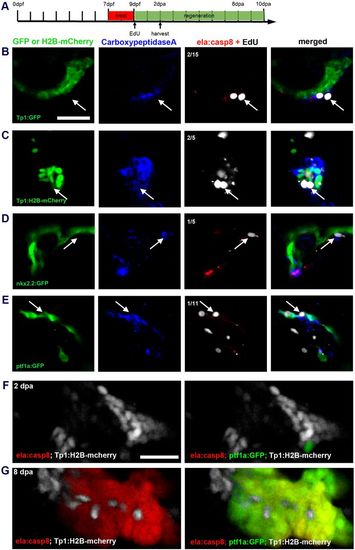
Identification of progenitor cells in the regenerating exocrine pancreas. (A) Timeline of short-term regeneration experiments shown in B-E indicating the time window of Dim treatment (red, 7-9 dpf), starting point of EdU treatment (0 dpa) and the fixation time (2 dpa). (B-E) Confocal image projection showing different lineage reporters (green), CPA antibody signals (blue), EdU signals (white, arrows indicate proliferating CPA+ cells) and E2Crimson (red; in C, E2Crimson and EdU staining are both shown white due to the Tp1:H2B-mcherry background). Note that CPA+ cells are negative for duct/NRC reporter expression in Tp1:eGFP (B), Tp1:H2B-mcherry (C) and nkx2.2:eGFP (D), whereas CPA signals match expression of ptf1a:GFP (E). (F,G) Comparison of reporter expression for NRCs (Tp1:H2B-mcherry, white), Ptf1a+(ptf1a:eGFP; green) and ela3l+ (ela:casp8, red) in triple transgenic larva at 2 dpa (F) and 8 dpa (G). NRCs signals localize next to Ptf1a+ cells at 2 dpa (F) and they intermingle with Ptf1a+ and ela3l+ labels at 8 dpa (G), but they do overlap with these markers. Scale bars: 20 µm. |
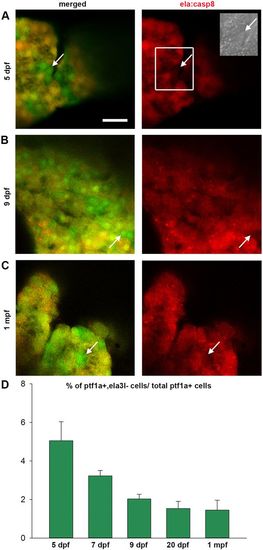
Ptf1a+, ela3l− cells are present at different developmental stages. (A-C) Confocal images of the anterior pancreatic region of Tg(ela:casp8; ptf1a:eGFP) in 5 dpf (A), 9 dpf (B) and 30 dpf (C) animals (arrows indicate selected GFP+, e2Crimson− cells). (D) Relative amount of ptf1a+, ela3l− cells at different developmental stages (n>5). Mean+s.e.m. Scale bar: 20 µm. |
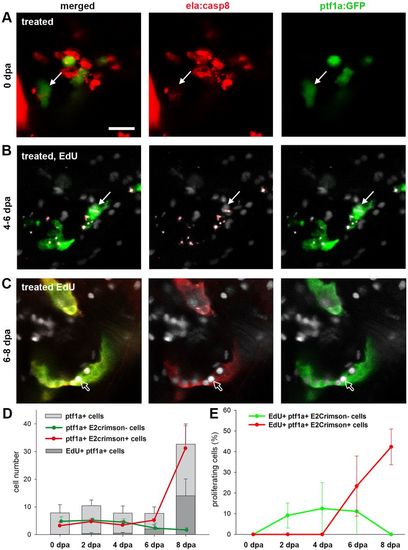
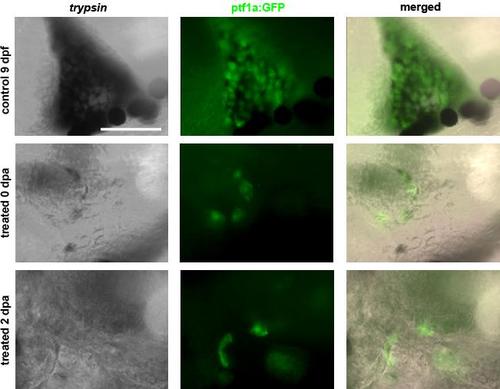
Ptf1a+ cells as a source for exocrine cell regeneration. (A-C) Confocal images of the pancreatic head region of EdU-labeled Tg(ela:casp8; ptf1a:eGFP) at 0 dpa (A), 6 dpa (B) and 8 dpa (C) following a 7-9 dpf ablation treatment showing that during regeneration, ptf1a+, ela3l− cells (white arrows) rarely proliferate and differentiated exocrine cells reconstitute the exocrine pancreas. (D) Absolute numbers of all ptf1a+ cells in the pancreatic head region, proliferating ptf1a+ cells and GFP+, E2Crimson− and GFP+, E2Crimson+ cells. (E) Relative amount of EdU+, ptf1a+, E2Crimson− and EdU+, ptf1a+, E2Crimson+ cells. Mean+s.e.m. Scale bar: 20 µm. |
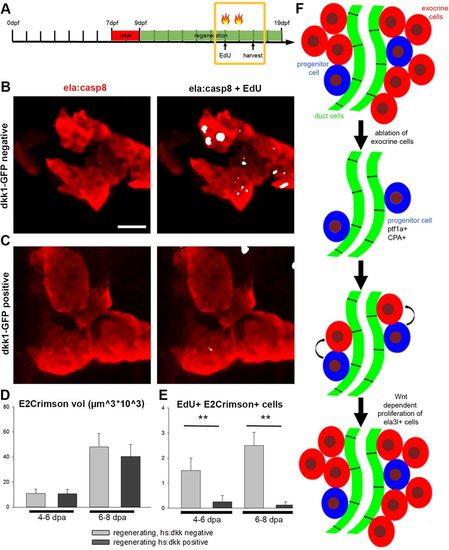
Proliferation of exocrine cells during regeneration is dependent on Wnt signaling. Confocal projections of Tg(ela:casp8) crossed to Tg(hsp70l:dkk1-eGFP) and treated with 5 µM Dim. During regeneration (4-6 dpa or 6-8 dpa) larvae were heat shocked twice to induce dkk1 and they were additionally injected with EdU. (A) Timeline indicating treatments and heat shock (flames). (B) Control littermate negative for dkk1-eGFP. (C) Larvae expressing dkk1-eGFP showed reduced numbers of EdU+ cells. Volume of E2Crimson cells (D) and EdU+ E2Crimson+ cells (E) in larvae expressing dkk1-eGFP and controls at 6 and 8 dpa during regeneration, showing that the induced expression of dkk1 reduces the number of EdU+ exocrine cells (N>4 larva for each time point). Mean+ s.e.m.; **P<0.001. (F) Model of exocrine cell regeneration after complete removal of exocrine cells. Scale bar: 20 µm. |
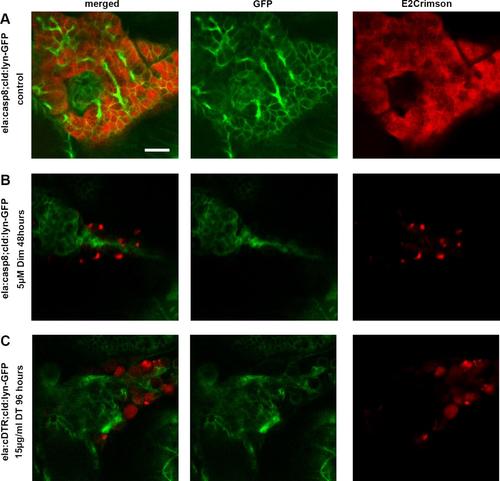
Loss of cell membranes of targeted exocrine cells. Tg(cld:lyn-GFP) was used to label cell membranes. Confocal projections of A, B: Tg(ela:casp8;ela:E2crimson) control and ablated larvae at 7 dpf. C: Tg(ela:DTR;ela:E2crimson) ablated larvae at 9 dpf. In B and C, E2crimson signal is mostly located in debris not associated with cell membranes and thus does not label intact exocrine cells after treatment. Scale bar: 20μm. |
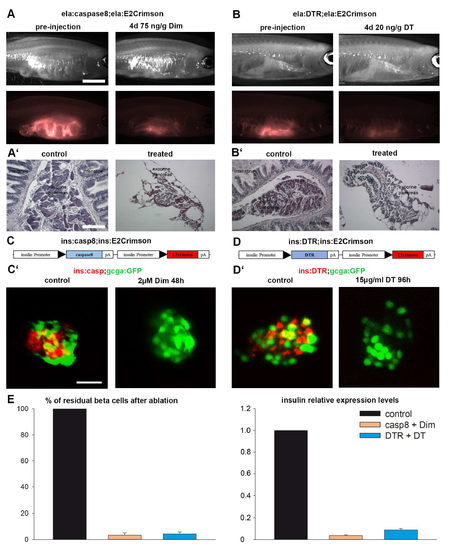
Ablation of exocrine tissue in adult zebrafish and beta cells in embryos. A: brightfield and epifluorescence images of ela:casp8 adults before intraperitoneal injection of 75ng/g Dim and 4 days after injection showing the loss of E2crimson fluorescence. A': histological sections of an intact exocrine pancreas of an untreated fish and of a disrupted exocrine pancreas 4 days after treatment. B: brightfield and epifluorescence images of ela:DTR adults before intraperitoneal injection of 20 ng/g DT and 4 days after injection showing the loss of E2crimson fluorescence. B': histological sections of an intact exocrine pancreas of an untreated fish and of an ablated exocrine pancreas four days after treatment. C: construct to target expression to the beta cells and C' confocal projections of endocrine islets of control and treated tg(ins:casp8;gcga:eGFP) embryos at 6 dpf; D: construct to establish the ins:DTR transgenics and D' confocal projections of endocrine islets of control and treated tg(ins:DTR;gcga;eGFP) embryos at 8 dpf. E: relative amount of beta cells and relative expression levels of insulin of control and [sic]. |
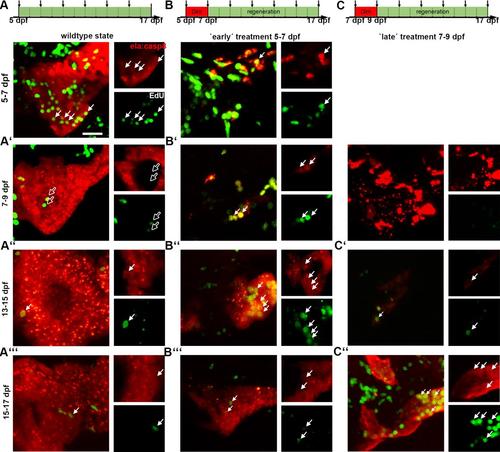
Dynamics of exocrine development and regeneration. Confocal projections and single plane images of the untreated and regenerating anterior portion of the exocrine pancreas of Tg(ela:casp8) stained for EdU. Larvae were treated with EdU for 48 hours before harvest. A: the exocrine pancreas in wildtype-state, E2Crimson positive exocrine cells and EdU incorporation at 7, 9, 15 and 17 dpf B: larvae treated with 5μM Dim from 5 to 7 dpf and injected with EdU at different time points. C: larvae treated with 5μM Dim from 7 to 9 dpf and injected with EdU. Scale bar: 20μm. |
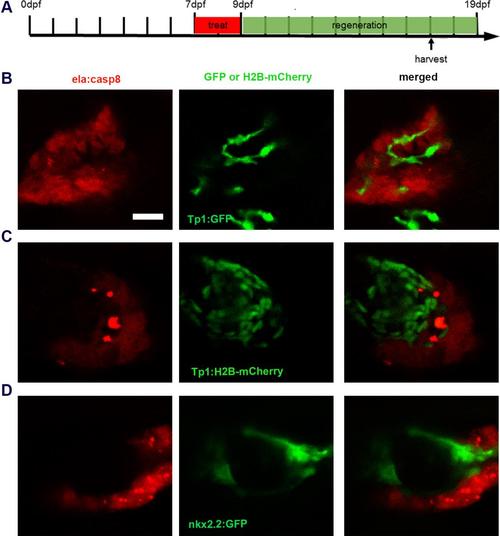
Duct cells are not involved in exocrine cell regeneration. A: timeline indicating time of treatment and harvesting of larvae. Confocal images of regeneration of exocrine cells at 8 dpa in tg(Tp1:GFP) (B), tg(Tp1:H2B-mCherry) (C) and tg(nkx2.2a:GFP) (D) background showing newly formed exocrine cells adjacent to the duct and no overlapping fluorophore expression. Scale bar: 20μm. |
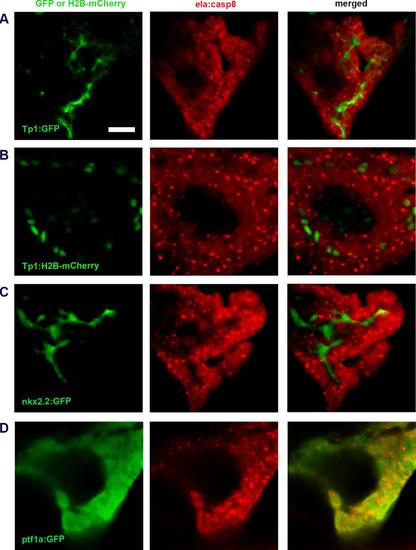
Confocal images of control animals ad. Fig. 4 Confocal images of untreated Tg(ela:casp8) at 11 dpf. A: Tg(Tp1:eGFP) labeling NRCs. B: Tg(Tp:H2B-mcherry) labeling NRCs in the nucleus.D: Tg(nkx2.2:eGFP) labeling ductal cells. E: Tg(ptf1a:eGFP) labeling ptf1a expressing cells. Scale bar: 20μm. |
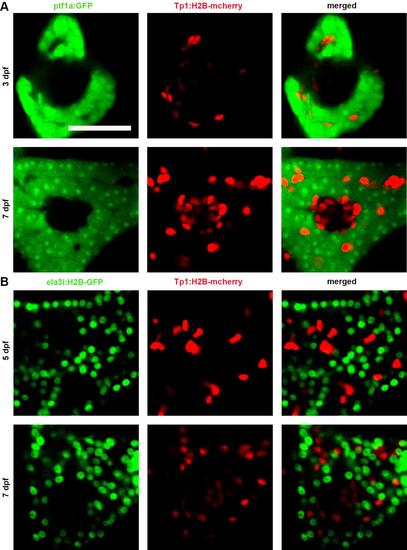
Exocrine progenitor cells and differentiated cells are not notch-responsive. Confocal projections of A: Tg(ptf1a:GFP; Tp1:H2B-mcherry) at 3 and 7 dpf showed no overlapping fluorophore expression. B: Tg(ela:H2B-GFP; Tp1:H2B-mcherry) at 5 and 7 dpf also showed no overlapping fluorophore expression. Scale bar: 50μm. |
Exocrine progenitor cells and differentiated cells are not notch-responsive. Confocal projections of A: Tg(ptf1a:GFP; Tp1:H2B-mcherry) at 3 and 7 dpf showed no overlapping fluorophore expression. B: Tg(ela:H2B-GFP; Tp1:H2B-mcherry) at 5 and 7 dpf also showed no overlapping fluorophore expression. Scale bar: 50μm. |
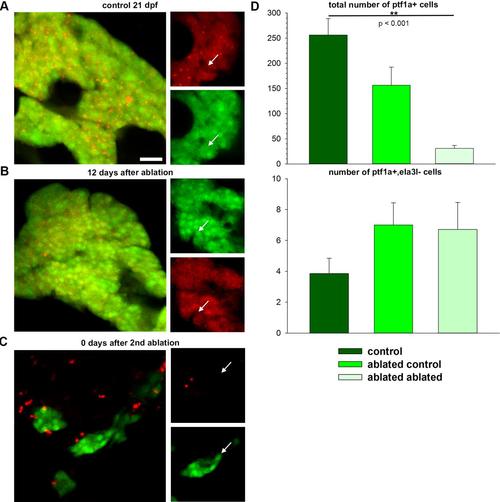
Ptf1a+ cells are maintained during regeneration. Confocal projections and single plane images (smaller images right to the projections) of A: untreated 21 dpf larva displaying mostly E2Crimson+ cells also positive for ptf1a:GFP; B: larva 12 days after an ablation of exocrine cells from 7 to 9dpf; C: larva at 0 dpa, treated a second time with Dim from 10 to 12 dpa showing ptf1a:GFP+ cells, not expressing E2Crimson; D: total number of ptf1a+ cells in control larvae (n=7), regenerating larvae (n=6) and double ablated larvae (n=7) and number of ptf1a+, ela3l- cells. Scale bar: 20μm. |