
- Title
-
Pharmacological targeting of the transcription factor SOX18 delays breast cancer in mice
- Authors
- Overman, J., Fontaine, F., Moustaqil, M., Mittal, D., Sierecki, E., Sacilotto, N., Zuegg, J., Robertson, A.A., Holmes, K., Salim, A.A., Mamidyala, S., Butler, M.S., Robinson, A.S., Lesieur, E., Johnston, W., Alexandrov, K., Black, B.L., Hogan, B.M., Val, S., Capon, R.J., Carroll, J.S., Bailey, T.L., Koopman, P., Jauch, R., Smyth, M.J., Cooper, M.A., Gambin, Y., Francois, M.
- Source
- Full text @ Elife
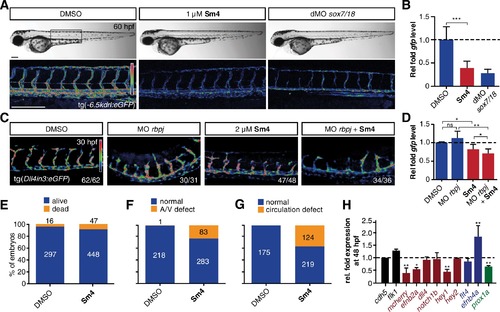
Sm4 blocks SoxF transcriptional activity in vivo. (A) Lateral brightfield (top) and fluorescent (bottom) images of 60 hpf zebrafish larvae carrying the tg(−6.5kdrl:eGFP) SoxF reporter. Treatment was initiated at late stage (20 hpf) with either DMSO (negative control) or 1 μM Sm4, or larvae were injected with morpholinos against both sox7 and sox18 (dMO sox7/18). Fluorescence intensity is shown as heatmap. Scale bar 200 μm (B) qRT-PCR analysis on gfp transcripts levels in treated tg(−6.5kdrl:eGFP) larvae and sox7/18 morphants, showing reduction of activity on this transgene. (C) Lateral view of zebrafish larvae carrying the tg(Dll4in3:eGFP) SoxF/Notch reporter that harbors multiple binding sites for Rbpj and SoxF transcription factors. Larvae were injected with a morpholino against rbpj and/or treated with 2 μM Sm4 from 13 hpf. (D) qRT-PCR analysis on gfp transcripts in tg(Dll4in3:eGFP) larvae, showing repression of combined SoxF/Notch activity in the Sm4-treated larvae. (E) Quantitation of embryonic lethality in larvae, treated with Sm4 or DMSO control from early stage (16 hpf) until 72 hpf. (F) Penetrance of vascular phenotype (arteriovenous shunting) in 48 hpf larvae treated with 1.5 µM Sm4 from 16 hpf. (G) Penetrance of circulation defect in 48 hpf larvae treated with 1.5 µM Sm4 from 16 hpf. (H) qRT-PCR analysis of endogenous endothelial transcript levels at 48 hpf in larvae treated with 1.5 µM Sm4 at 16 hpf, relative to DMSO control (dotted line). Data shown are mean ± s.e.m. *p<0.05, **p<0.01, ***p<0.001. |
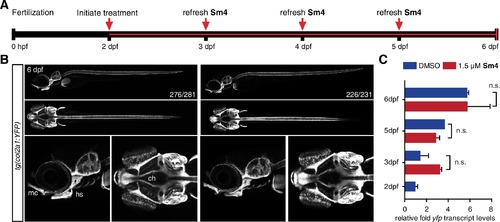
Sox9 activity is not perturbed by treatment in vivo. (A) Timeline of treatment: Zebrafish larvae were treated continuously for four days during chondrogenesis. Medium was refreshed daily throughout the experiment to maintain Sm4 levels. (B) tg(col2a1:YFP) Sox9 reporter larvae marking cartilage (Mitchell et al., 2013). YFP levels were unaffected in presence of Sm4, and no changes in chondrogenesis were observed. mc: Meckel’s cartilage, ch: ceratohyal, hs: hyosymplectic. (C) qRT-PCR of yfp transcript levels in DMSO control and Sm4 treated larvae at a series of stages throughout chondrogenesis. |
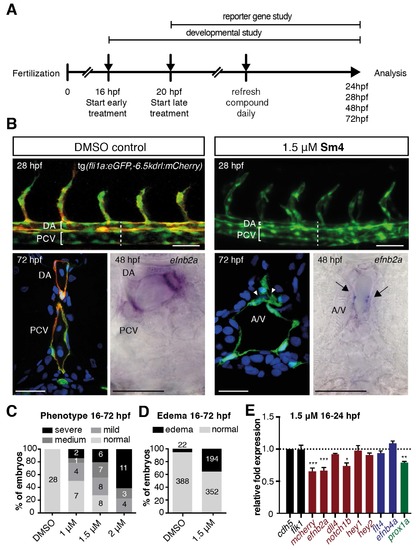
Sm4 interferes with SoxF activity in vivo. (A) Timeline of Sm4 treatment in zebrafish larvae. Treatment for SOXF reporter gene studies was initiated at 20 hpf, while for the phenotypic studies treatment was initiated at precedes that for, to act during the right developmental window for arteriovenous specification. (B) Lateral view and transverse section of the trunk region of DMSO control and Sm4-treated tg(fli1:eGFP,−6.5kdrl:mCherry) larvae. Control DMSO larvae formed a distinctly separated dorsal aorta (DA) and posterior cardinal vein (PCV). In Sm4-treated larvae, the DA was constricted and/or fused to the PCV (arrowheads). Whole mount in situ hybridization against arterial marker efnb2a shows reduced expression and compromised formation of the DA and in Sm4-treated larvae at 48 hpf (arrows). Sections were DAPI stained (in blue). Scale bar brightfield: 0.5 mm, fluorescent and in situ 25 μm. (C) Concentration dependent effect of Sm4, showing quantitation for predominant phenotype at 72 hpf: mild (tail curvature), medium (dilation of the PCV) or severe (arteriovenous defect and/or circulation defect). Indicated timeframe refers to Sm4 treatment window and endpoint. (D) Quantitation of cardiac edema frequency in larvae treated with Sm4 (1.5 μM). (E) qRT-PCR analysis of Sox18 dependent −6.5kdrl:mCherry and endogenous endothelial transcript levels in Sm4-treated larvae relative to DMSO control (dotted line), showing effect on arterial and venous markers at 24 hpf. All expression levels were normalized to expression of endothelial marker cdh5. Data shown are mean ± s.e.m. *p<0.05, **p<0.01, ***p<0.001. EXPRESSION / LABELING:
PHENOTYPE:
|