
- Title
-
Osteocrin, a peptide secreted from the heart and other tissues, contributes to cranial osteogenesis and chondrogenesis in zebrafish
- Authors
- Chiba, A., Watanabe-Takano, H., Terai, K., Fukui, H., Miyazaki, T., Uemura, M., Hashimoto, H., Hibi, M., Fukuhara, S., Mochizuki, N.
- Source
- Full text @ Development
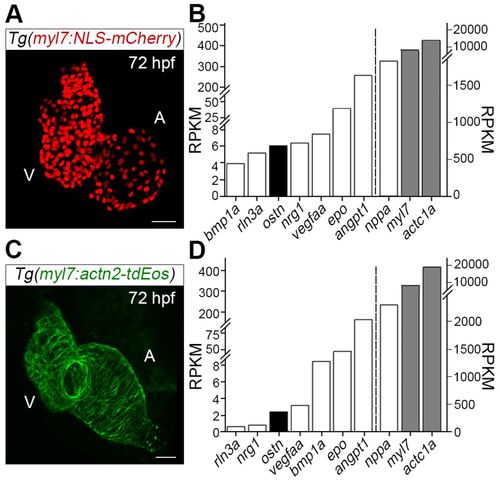
Osteocrin (Ostn) is produced in cardiomyocytes of zebrafish. (A) Projection view of confocal images of the Tg(myl7:NLS-mCherry) heart at 72 hpf. A, atrium; V, ventricle. (B) RNA-seq analyses of mCherry-positive cardiomyocytes (CMs) from the hearts of Tg(myl7:NLS-mCherry) larvae at 72 hpf. Left and right y-axes report RPKM (reads per kilobase per million sequenced reads) values for the secretory molecules (left of the dashed line) and positive controls (right of the dashed line), respectively. Gray bars are used for structural proteins, white bars for secretory molecules. (C) Projection view of confocal images of the Tg(myl7:actn2-tdEos) heart at 72 hpf. (D) RNA-seq analyses of tdEos-positive CMs of Tg(myl7:actn2-tdEos). Axes descriptions as in B. Scale bars: 30 µm. |
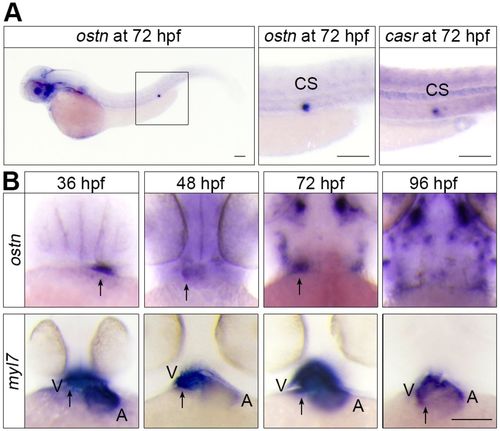
Ostn is expressed in the ventricle of hearts and corpuscles of Stannius. (A) Whole-mount in situ hybridization (WISH) analyses of ostn mRNA expression in a zebrafish larva at 72 hpf (left), and ostn (middle) and casr (right) mRNA expression at corpuscles of Stannius (CS). (B) WISH analyses of ostn and myl7 mRNAs of larvae at the indicated time points. Arrows indicate the ventricles. A, atrium; V, ventricle. Scale bars: 100 µm. |
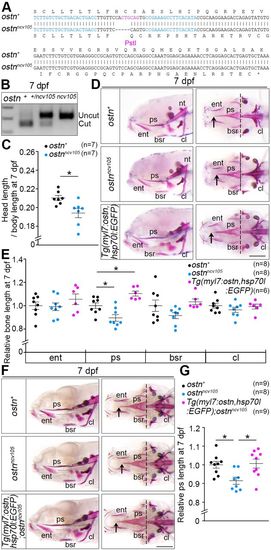
Depletion and overexpression of Ostn result in shortening and elongation, respectively, of the parasphenoid at an early stage. (A) DNA and corresponding amino acid sequence of the ostnncv105 allele. The 5 bp deletion in ostnncv105 leads to the mutation of 40 amino acids followed by a premature termination (asterisk). (B) Genotype of wild-type (+), heterozygous (+/ncv105) and homozygous (ncv105) alleles as confirmed by digestion of PCR products containing a PstI site as indicated in A. (C) Ratio of head length [from the tip of the upper jaw to the caudal part of the Alizarin Red stained notochord (nt)] to body length (from the tip of the upper jaw to the end of the tail) of 7 dpf wild-type (+) or homozygous mutant (ncv105) larvae. Each point indicates data from an individual larva. n, number of larvae examined. (D) Representative images of Alizarin Red staining of 7 dpf larvae of wild type (top), ostnncv105 homozygous mutant (middle) and Tg(myl7:ostn,hsp70l:EGFP) (bottom). Lateral view (left) and ventral view (right), anterior to the left. Arrows and dashed lines indicate the tip and the top of the concave in the caudal part of the parasphenoid (ps), respectively. (E) Quantitative analyses of cranial bone length of 7 dpf ostnncv105 and transgenic larvae relative to the mean length of wild-type bones is plotted for entopterygoid (ent), ps (between arrow and dashed line in D), branchiostegal ray (bsr) and cleithrum (cl). (F) Representative images of Alizarin Red staining of 7 dpf larvae of wild type (top), ostnncv105 homozygous mutant (middle) and Tg(myl7:ostn,hsp70l:EGFP);ostnncv105. Views as in D. (G) Quantitative analyses of F. Data were analyzed by Student's t-test or one-way ANOVA with Tukey's test. *P<0.05. Error bars indicate s.e.m. Scale bars: 200 µm. PHENOTYPE:
|
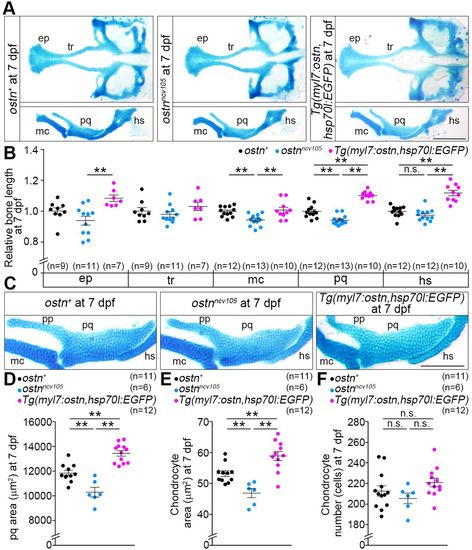
Ostn regulates the growth of endochondral bone formation. (A) Representative images of Alcian Blue staining of cranial cartilages of a wild-type (ostn+; left), ostnncv105 mutant (center) and Ostn-overexpressing [right; Tg(myl7:ostn,hsp70l:EGFP)] larva at 7 dpf. ep, ethmoid plate; tr, trabeculae; mc, Meckel's cartilage; pq, palatoquadrate; hs, hyosymplectic. (B) Quantitative analyses of A. Bone length relative to the mean length of wild-type bones is plotted. (C) Representative images of Alcian Blue staining of cartilages of the lower jaw of a wild-type, ostnncv105 mutant and Ostn-overexpressing larva at 7 dpf. pp, pterygoid process. (D) Quantitative analyses of the area of the ps of wild-type, ostnncv105 mutant and Ostn-overexpressing larvae at 7 dpf. (E) Quantitative analyses of the area of individual chondrocytes in the pq. (F) The number of chondrocytes in the pq. **P<0.01; n.s., no significant difference between two groups. Error bars indicate s.e.m. Scale bars: 200 µm in A; 100 µm in C. |
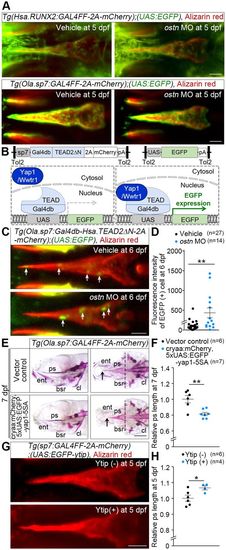
Ostn regulates osteogenesis through Yap1/Wwtr1. (A) runx2 and sp7 promoter activity monitored by EGFP in the ps of Tg(Hsa.RUNX2:GAL4FF-2A-mCherry);(UAS:EGFP) larvae (top) and those of Tg(Ola.sp7:Gal4FF-2A-mCherry);(UAS:EGFP) (bottom) treated with vehicle (left) or ostn MO (right). Confocal images are of larvae stained with Alizarin Red at 5 dpf. (B) Illustration of how Tg fish enable detection of nuclear translocation of Yap1/Wwtr1 by EGFP expression in tissues where the sp7 promoter is active. (C) Confocal images of the ps of Tg larvae injected with vehicle (top) or ostn MO (bottom) and stained with Alizarin Red at 6 dpf. Arrows indicate EGFP-positive cells, which correspond to those in which Yap1/Wwtr1 enter the nucleus. (D) Quantitative analysis of C. The intensity of the EGFP-positive area in the ps is plotted. The number of EGFP-positive areas quantified is indicated at the top. (E) Representative images of Alizarin Red staining of Tg(Ola.sp7:Gal4FF-2A-mCherry) larvae at 7 dpf transiently transfected with the plasmids indicated on the left. Lateral view (left) and ventral view (right), anterior to the left. Arrows and dashed lines indicate the tip and the top of concave of the caudal part of the ps, respectively. (F) Quantitative analyses of ps length of the larvae in E. The length of ps was measured as in Fig. 3E. (G) Representative images of Alizarin Red staining of the ps of Tg(Ola.sp7:GAL4FF-2A-mCherry);(UAS:EGFP-ytip) larvae at 5 dpf. (H) Quantitative analyses of G. ps length relative to the mean length of the wild-type ps was plotted. *P<0.05, **P<0.01. Error bars indicate s.e.m. Scale bars: 50 µm in A,C,G; 200 µm in E. EXPRESSION / LABELING:
|