
- Title
-
An ongoing role for Wnt signaling in differentiating melanocytes in vivo
- Authors
- Vibert, L., Aquino, G., Gehring, I., Subkhankulova, T., Schilling, T.F., Rocco, A., Kelsh, R.N.
- Source
- Full text @ Pigment Cell Melanoma Res.
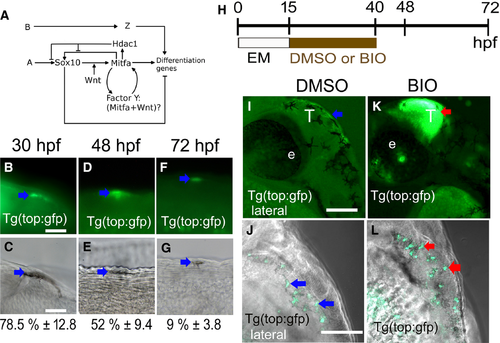
Ongoing Wnt signaling is detectable in differentiating melanocytes. (A) Diagram of working model for melanocyte core GRN (modified from Greenhill et al., 2011). Note, two inputs from Wnt signaling on mitfa expression, one well-established role acting alongside Sox10 driving melanocyte fate specification, and hypothetical role explored here as part of a positive-feedback loop also involving Mitfa itself. (B–G) Wnt signaling in differentiating melanocytes was assessed by scoring samples of melanocytes for detection of dGFP by immunofluorescence in Tg(top:GFP) transgenic embryos from 30 to 72 hpf. GFP-positive melanocytes (arrows) are shown by immunofluorescence (B, D, F) and DIC (C, E, G) to show melanin pigment. At each stage, 30 melanocytes in each of 15 embryos were assessed for GFP expression, in the dorsal head and throughout the dorsal and lateral trunk; numbers show the percentage of melanocytes expressing GFP (mean ± SD) at corresponding stages (n = 450 per stage). (H) Schematic showing timing of BIO treatment used. (I–L) BIO treatment enhances activity of Tg(top:GFP) reporter. BIO treatment from 15 to 40 hpf dramatically enhances dGFP expression (red arrows) in the tectum of treated (K) compared with mock-treated controls (I) and also increases dGFP signal in melanocytes of Tg(top:GFP) embryos [BIO-treated (L) compared with mock-treated control (J)]. All images, lateral views using confocal microscopy. EM, embryo medium; e: eye; T: tectum. Scale bars: (B–G) 10 μm; (I–L) 100 μm. |
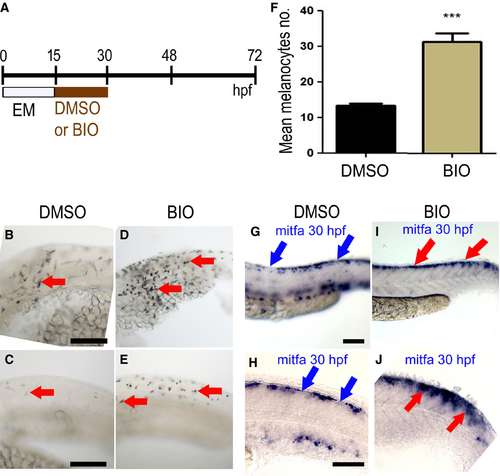
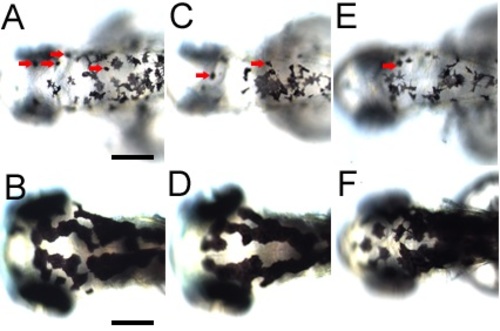
Elevated Wnt signaling in melanocyte specification time window increased numbers of melanocytes. (A) Schematic showing timing of BIO treatment or control mock treatment (DMSO alone) used. (B–E) Lateral views of the trunk of live 30 hpf zebrafish embryos showing melanocytes (red arrows); note, increased number in both anterior (D) and posterior trunk (E) of embryos treated with 5 μM BIO compared with control DMSO-treated embryos (B, C, respectively). (F) Quantitation of increased melanocyte number in heads of BIO-treated embryos (mean ± SD; control, 13 ± 2.1; BIO, 32 ± 5.3, P < 10−6) (n = 20; *** indicates significant difference between treated and mock treated; unpaired, one-tailed t test). (G–J). Lateral views of posterior trunk (G, I) and close-up of anterior tail (H, J) of 30 hpf zebrafish embryo in situ hybridisations to show mitfa expression in embryos treated with BIO (I, J) or DMSO control (G, H). In the DMSO control embryos (G, H), discontinuous mitfa expression is observed in the dorsal region (blue arrows show discontinuities of the signal), whereas in the BIO-treated embryos (I, J), mitfa expression is continuous throughout the dorsal region (red arrows). Images show representative phenotypes (n = 20 per treatment). Scale bar: 100 μm. |
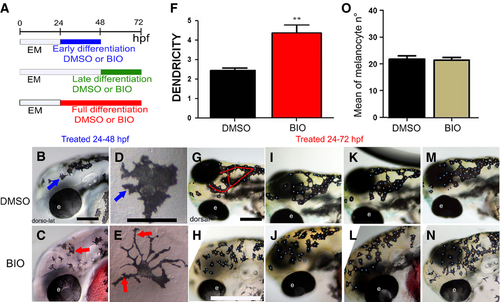
Elevated Wnt signaling in melanocyte differentiation time window alters melanocyte morphology. (A) Schematic of melanocyte differentiation BIO treatment time windows. (B–E) Activation of Wnt signaling in early differentiation period (24–48 hpf) increases melanocyte dendricity and dispersion. Lateral view at 48 hpf of head of live embryos treated with control DMSO (B) or BIO (C) from 24 to 48 hpf. Panels D and E show enlargements of head melanocytes from embryos in B and C, respectively. (F) Quantitation of dendricity: the cell roundness parameter was calculated for each melanocyte as R = P2 ⁄ 4∏A, where A is the cell area and P the cell perimeter, and 20 cells were investigated (n = 20) in 10 different embryos for each condition. A score of R = 1.0 represents a perfectly round melanocyte; increased R values represent increased dendricity. Control, R = 2.44 ± 0.43, BIO R = 4.25 ± 1.68, P = 0.004, t test result, P-value < 0.01 (**). (G–J) Elevated Wnt signaling throughout full differentiation or during late differentiation window only affects melanocyte organization. Red line in G indicates the dorsal head melanophores which usually approximate an O- or U-shaped pattern, although often with extra branches as in this specific example. Dorsolateral view at 72 hpf of heads of live embryos treated with control DMSO (G, I, K, M) or BIO (H, J, L, N) from 24 to 72 hpf shown. Note that embryos treated in only late differentiation window (48–72 hpf) show equivalent phenotype (data not shown). Embryos shown are representative of samples examined (n = 160 zebrafish embryos for each treatment). Scale bars: 100 μm (B, D, G, I). |
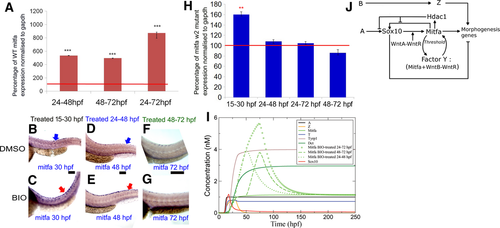
Positive feedback between Wnt signaling and Mitfa during late differentiation phase of melanocyte development. (A) Quantitation of mitfa expression by RT-qPCR showing significantly increased levels in BIO-treated embryos compared with untreated controls; data are expressed as percentage of mock-treated controls [control mitfa level = 100% transcripts (red line on graph)]. Gene expression was investigated in 10 samples consisting of the trunk and tail of 50 embryos for each condition and in triplicate, after normalization to the stable expression of a reference house-keeping gene, gapdh. All treatments caused significant increase of mitfa expression [t test, two-tailed: 24–48 hpf, 535 ± 7.1 (P = 0.00087); 48–72 hpf, 496 ± 9.8 (P = 0.0085); 24–72 hpf, 872 ± 32.1 (P = 0.000092). ***P-value < 0.001]. (B–G) Activating Wnt signaling after 48 hpf does not affect mitfa expression in mitfaw2 mutant embryos during melanocyte differentiation. Lateral views of trunk showing in situ hybridisation for mitfa expression in mitfa mutant fish. mitfa mutant embryos treated with BIO in the melanocyte specification phase (15–30 hpf) (C) showed increased mitfa expression (purple) compared to DMSO-treated embryos (B). Similarly, mitfa mutant embryos treated with BIO in the melanocyte early differentiation phase (24–48 hpf) (E) showed increased mitfa expression in tail dorsal stripe melanocytes compared to DMSO-treated embryos (D). In contrast, mitfa mutant embryos treated with BIO throughout the late melanocyte differentiation phase (48–72 hpf) (G) did not show increased mitfa expression compared to DMSO-treated embryos (F) at 72 hpf; 40 zebrafish embryos were investigated for each condition; BIO-treated and matched control embryos were processed for in situ hybridisation in parallel and under identical conditions. (H) Quantitation of mitfa expression by RT-qPCR showing significantly increased levels in BIO-treated embryos at 30 hpf compared with untreated controls but not at 48 hpf nor at 72 hpf; data are expressed as percentage of mock-treated controls [control mitfa level = 100% transcripts (red line on graph)]. Gene expression was investigated in triplicate, after normalization to the stable expression of a reference housekeeping gene, gapdh. Only 15–30 hpf treatment caused significant increase of mitfa expression [t test, two-tailed: 15–30 hpf, 160.39 ± 7.27 (P = 0.0020); 24–48 hpf, 108.15 ± 7.9 (P = 0.0675); 24–72 hpf, 104.6 ± 8.36 (P = 0.544); 24–72 hpf, 86.14 ± 8.96 (P = 0.0831). **P-value < 0.01]. (I) The effect of the three BIO treatments applied in the 24–48, 48–72, and 24–72 hpf time windows is shown on Mitfa only as compared to the case of no treatment. The 24–48 and 48–72 hpf BIO treatments induce an approximately equal increase of Mitfa as measured at the end of the treatment. (J) Revised GRN model. Scale bars: 100 μm. |
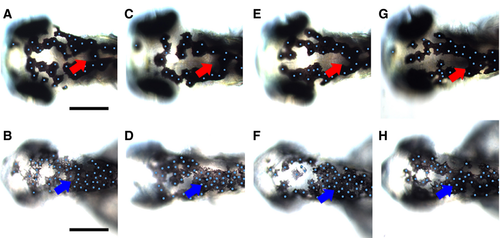
Inactivation of Wnt signaling during melanocyte differentiation enhances melanocyte clustering in posterior dorsal head. Tg(hsp70l:tcf3-deltaC-GFP) embryos were heat-shocked at 29, 36, 48, and 62 hpf and observed at 73 hpf (B, D, F, H) and compared to control non-heat-shocked transgenic Tg(hsp70l:tcf3-deltaC-GFP) (A, C, E, G). Note the enhanced clustering of melanocytes in the posterior part of the dorsal head in treated embryos (blue arrowheads); the normal distribution in this area in untreated controls is indicated by red arrows. Heat shock activation of Wnt inhibition consistently resulted in smaller heads and eyes. Scale bars: 100 μm. |
Strong expression of a dntcf3 transgene results in poor melanocyte differentiation. |