
- Title
-
Mural-Endothelial cell-cell interactions stabilize the developing zebrafish dorsal aorta
- Authors
- Stratman, A.N., Pezoa, S.A., Farrelly, O.M., Castranova, D., Dye, L.E., Butler, M.G., Sidik, H., Talbot, W.S., Weinstein, B.M.
- Source
- Full text @ Development
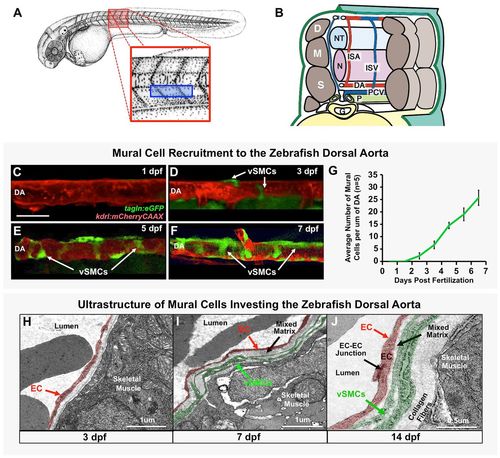
Vascular smooth muscle cells associate with the zebrafish dorsal aorta. (A) Camera lucida drawing of a 2 dpf zebrafish embryo (Kimmel et al., 1995), with the magnified red boxed region shown in B and blue boxed region imaged in C-F. (B) Schematic (‘cut-away’) diagram showing the anatomy of the zebrafish trunk and its blood vessels at approximately 2 days post-fertilization. Trunk circulation flows through the dorsal aorta (DA), posterior cardinal vein (PCV) and intersegmental arteries (ISA) and intersegmental veins (ISV). The vessels are shown relative to adjacent tissues and structures in the mid-trunk including the gut (G), notochord (N), neural tube (NT), left pronephric duct (P), dermamyotomes (D), myotomes (M) and sclerotomes (S). (C-F) Representative confocal images of the dorsal aorta in Tg(tagln:egfp), Tg(kdrl:mCherryCAAX) double transgenic zebrafish at 1 dpf (C), 3 dpf (D), 5 dpf (E), or 7 dpf (F), with red fluorescent vascular endothelium and green fluorescent vSMCs, showing accumulation of vSMCs on the dorsal aorta. (G) Quantification of vSMC accumulation on the first 6-somite segments of the dorsal aorta at 1-7 dpf. Values are mean±s.e.m.; n=5 fish. (H-J) Vascular smooth muscle cell investment of the DA was confirmed by electron microscopy. Representative images of the dorsal aorta wall at 3 dpf (H), 7 dpf (I) and 14 dpf (J) are shown. ECs and vSMCs are pseudo-colored red and green, respectively. Panel B is adapted from Isogai et al. (2003). Scale bar: 50 µm (C-F). |
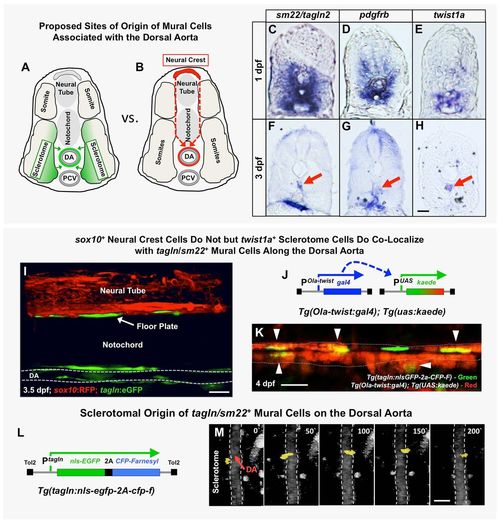
The origins of trunk vSMCs. (A,B) Schematic diagrams illustrating two alternative models for the origin and migration of vSMCs recruited to the dorsal aorta, either from the sclerotome (A) or from the trunk neural crest (B). (C-H) Transverse sections of the trunk from 1 dpf (C-E) or 3 dpf (F-H) animals subjected to whole-mount in situ hybridization expression analysis, probed with tagln2 (C,F), pdgfrb (D,G) or twist1a (E,H). All three markers are expressed more broadly in the sclerotome at 1 dpf (C-E), but by 3 dpf their expression becomes restricted to SMCs of the DA (red arrows) and gut (F,G) or DA alone (H). (I) Confocal lateral view image of the mid-trunk of a 3.5 dpf Tg(tagln:gfp), Tg(sox10:rfp) double transgenic animal. The lack of RFP expression along the dorsal aorta suggests tagln+ vSMCs are not of neural crest origin. DA, dorsal aorta. (J) Schematic diagram of the Tg(Ola-twist:gal4) and Tg(uas:kaede) transgenes. In Tg(Ola-twist:gal4), Tg(uas:kaede) double transgenic fish, the medaka (Oryzias latipes) twist promoter (Ola-twist) is used to drive expression of Gal4 from the Ola-twist:gal4 transgene, which then activates expression of green to red photoconvertible kaede from the uas:kaede transgene. (K) Confocal lateral view image of the dorsal aorta in a 4 dpf Tg(Ola-twist:gal4), Tg(uas:kaede), Tg(tagln:nlsGFP-2a-CFP-F) triple-transgenic animal in which sclerotome-expressed kaede was photoconverted to red fluorescence at 4 dpf to mark twist1-positive cells. Numerous double-positive tagln+ (green nucleus), twist+ (red cytoplasm) cells are clearly evident on the dorsal aorta (arrowheads). A total of five fish were imaged in two rounds of photoconversion experiments with equivalent results. (L) Schematic diagram of the Tg(tagln:nlsgfp-2a-cfp-f) transgene, with the tagln promoter driving expression of nuclear-localized GFP and membrane-localized farnesyl CFP, joined by a 2A peptide linker. (M) Selected frames from a confocal time-lapse image series collected from a Tg(tagln:nlsgfp-2a-cfp-f), Tg(kdrl:mCherryCAAX) double-transgenic fish shows the movement of a tagln+ nucleus (yellow) from the adjacent sclerotome to the dorsal aorta (demarcated by dashed lines). The image reconstructions shown are ventral views, with rostral to the top. Confocal images were acquired every 10 min and the displayed stills are shown at approximately 50 min intervals. In total, seven tagln+ nuclei investing the DA were traced to the sclerotome in five separate time-lapse experiments. Scale bars: 50 µm. |
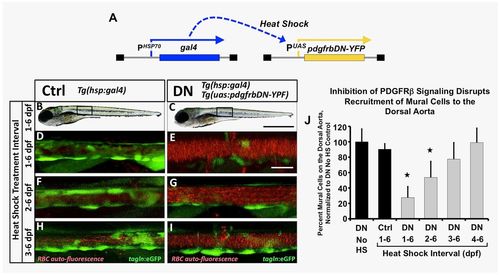
Inhibition of pdgfr signaling leads to loss of mural cell coverage on the dorsal aorta. (A) Schematic diagram showing the Tg(HSP70:gal4 and UAS:pdgfrbDN-YFP) double transgenes used for heat shock-inducible expression of pdgfrbDN. These fish were outcrossed to Tg(tagln:egfp) transgenic fish to generate triple heterozygotes, heat shocked daily for the indicated time frame and imaged for analysis of mural cell coverage at 6 dpf. (B-I) Representative confocal images of 6 dpf heat shocked Tg(tagln:egfp), Tg(HSP70:gal4) control (Ctrl, B,D,F,H) or Tg(tagln:egfp), Tg(HSP70:gal4), Tg(UAS:pdgfrbDN-YFP) dominant negative-expressing (DN, C,E,G,I) animals are shown. Fish were heat shocked daily from 1-6 dpf (B-E), 2-6 dpf (F-G) or 3-6 dpf (H-I) and then imaged at 6 dpf. The tagln/sm22+ vSMCs associated with the dorsal aorta are shown in green; red blood cell autofluorescence showing the vascular compartment is in red. (J) Quantification of the number of vSMCs covering the dorsal aorta following the indicated heat shock interval. Tg(tagln:egfp), Tg(HSP70:gal4), Tg(UAS:pdgfrbDN-YFP) heat shock-inducible dominant negative PDGFRB (DN) or Tg(tagln:egfp), Tg(HSP70:gal4) control (Ctrl) fish were heat shocked as indicated, imaged at 6 dpf and the number of tagln/sm22+ cells per 3-somite segment length of dorsal aorta counted. Values were normalized to the tagln/sm22+ cell counts from non-heat shocked DN fish. Values are mean±s.e.m.; *P≤0.05 significance compared with non-heat shocked DN fish. Data are presented from a single experiment of n=5 fish; two experimental replicates for 2, 3, 4 day HS experiments and four experimental replicates from 1-6 day HS were carried out as validation showing consistent results. In more absolute values, we typically see approximately 20 vSMCs recruit to a 3-somite segment of dorsal aorta under control conditions, and ∼7-8 vSMCs recruit to a 3-somite length of dorsal aorta under DN activation conditions. Scale bars:1 mm (B,C) and 50 µm (D-I). |
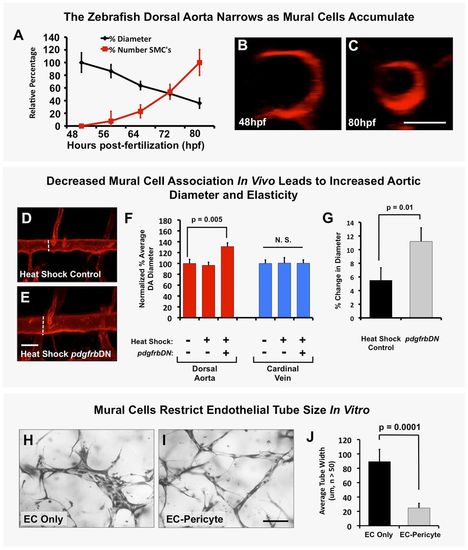
Mural cells regulate aortic diameter and elasticity. (A) Accumulation of vSMCs on the dorsal aorta inversely correlates with reduced dorsal aorta diameter over time during zebrafish vascular development. Dorsal aorta diameter is normalized to starting 48 hpf value and vSMC number is normalized to final 80 hpf value. n=3 fish. (B,C) Representative 2 dpf (B) and 3.25 dpf (C) transverse reconstructions of confocal images of the dorsal aorta in Tg(kdrl:mCherryCAAX) transgenic zebrafish, shown at the same magnification. (D,E) Loss of mural cell coverage leads to expansion of the zebrafish dorsal aorta. Representative 5 dpf confocal images of the mid-trunk dorsal aorta in Tg(kdrl:mCherryCAAX), Tg(tagln:egfp), Tg(HSP70:gal4) control (D) or Tg(kdrl:mCherryCAAX), Tg(tagln:egfp), Tg(HSP70:gal4), Tg(UAS:pdgfrbDN-YFP) dominant negative pdgfrbDN transgene-expressing (E) embryos that were heat shocked for a full 1-5 day time course. (F) Quantification of dorsal aorta diameter, demonstrating marked expansion of the dorsal aorta in heat shock pdgfrbDN fish compared with non-heat shocked or heat shocked control siblings. No effects were noted on the diameter of the cardinal vein. A minimum of three fish were measured per sample, with ten separate dorsal aorta measurements per fish. Experiments were repeated three times showing consistent results; N.S., not significant. (G) Loss of vSMC coverage leads to increased elasticity of the dorsal aorta in the developing zebrafish embryo. Heat shock control (maintains vSMC coverage) versus heat shock pdgfrbDN (demonstrates marked loss of vSMC coverage) fish were imaged using SPIM. Images were acquired at 22 frames per second to capture the movement of the wall of the dorsal aorta (‘elasticity’) as it expands and retracts in accordance with the animal's heartbeat. Data are reported as a percentage diameter change [(maximal width of the aorta-minimal width of the aorta)/minimal width of the aorta×100]. Five fish were measured per sample, with three separate dorsal aorta measurements taken per fish. Mean±s.e.m. (H-J) Regulation of EC tube diameter by mural cells can be modeled in 3D collagen matrix assays in vitro. Representative images of EC-only culture (H) and EC-pericyte co-cultures (I) are shown. (J) Quantification of endothelial tube diameter in EC-only cultures and EC-pericyte co-cultures established in 3D collagen matrices, showing a marked reduction in EC tube diameter in the presence of mural cells (pericytes). n=5 images from separate collagen plugs, ten measurements per image. Scale bars: 50 µm. Values are mean±s.d. |
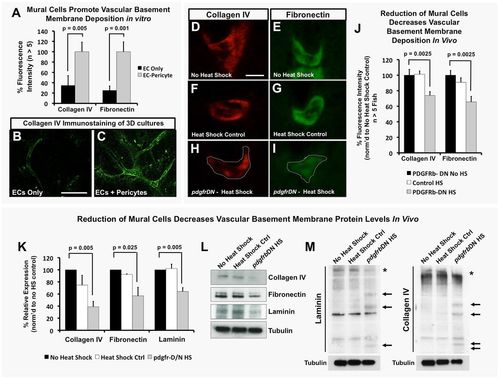
EC-mural cell interactions promote deposition and maintenance of the vascular basement membrane. (A-C) Mural cells promote vascular basement membrane deposition in vitro. (A) Quantification of basement membrane components collagen IV and fibronectin in 3D collagen matrix assays with ECs alone (black) or EC-pericyte co-cultures (gray) using detergent-free immunostaining protocols to assess only the extracellular deposition of these proteins. Representative images of collagen IV staining in EC only (B) and EC-pericyte co-cultures (C); n>5 individual immunostained collagen plugs. (D-J) vSMCs promote vascular basement membrane deposition and stability in vivo. (D-I) Representative images of collagen IV (D,F,H) or fibronectin (E,G,I) immunostaining of the dorsal aorta in transverse paraffin sections of 5 dpf no heat shock double transgenic Tg(HSP70:gal4; UAS:pdgfrbDN-YFP) animals (D,E), 1-5 dpf heat-shocked control Tg(HSP70:gal4) animals (F,G) or 1-5 dpf heat-shocked pdgfrbDN-expressing double transgenic Tg(HSP70:gal4; UAS:pdgfrbDN-YFP) animals (H,I). (J) Quantification of 5 dpf dorsal aorta collagen IV or fibronectin immunostaining intensity using the relative basement membrane staining intensity of sections such as those shown in D-I. All data are shown as a percentage of the no heat shock control condition. n=10 fish total, combined data from three individual experiments. (K) Quantification of basement membrane protein levels by western blot analysis (n=3 blots, from three individual experiments) of each of the conditions shown in D-J. Data are represented as a percentage of the no heat shock control condition. (L) Representative western blot images are shown versus a tubulin loading control. (M) The ability of mural cells to regulate maintenance of full-length basement membrane components was analyzed by collecting protein lysates under non-reducing conditions. No heat shock control, heat shock control (not carrying the pdgfrbDN cassette) and pdgfrbDN, heat shock treatment lysates were collected for analysis of protein fragmentation levels of collagen IV and laminin proteins. Representative western blots are shown, with increased fragmentation (highlighted by arrows) of the proteins noted only in the pdgfrbDN heat shock condition, where mural cell coverage has been disrupted. Location of the full-length proteins is marked with an asterisk. Representative western blots from lysates of ten pooled zebrafish embryos and two individual experiments. Scale bars: 50 µm. Values are mean±s.e.m. |
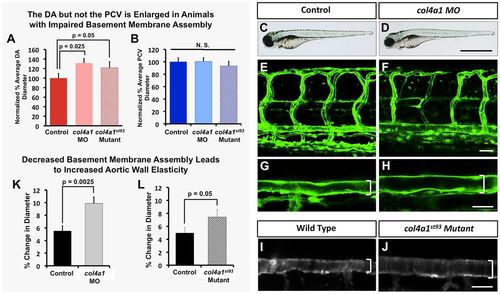
The vascular basement membrane functionally regulates aortic diameter and stability. Impaired basement membrane assembly leads to increased aortic diameter and elasticity. (A,B) Quantification of dorsal aorta (A) and posterior cardinal vein (B) diameter in 4 dpf col4a1 morpholino-injected or col4a1st93/st93 mutant animals compared with control wild-type animals. A minimum of four fish were measured per sample, with ten separate dorsal aorta measurements per fish. N.S., not significant. (C-J) Representative transmitted light (C,D) and confocal (E-J) images of 4 dpf control (C,E,G,I), col4a1 morpholino-injected (D,F,H), or col4a1st93 mutant (J) animals, showing lateral views of entire animal (C,D) lateral views of the trunk vasculature (E,F) and higher-magnification lateral images of the dorsal aorta (G-J). Brackets indicate diameter of dorsal aorta. (K,L) Quantification of dorsal aorta elasticity in 4 dpf col4a1 morpholino-injected (K) or col4a1st93 mutant (L) animals compared with control wild-type animals, using SPIM. Data are reported as percentage diameter change. A minimum of four fish were measured per sample, with three separate dorsal aorta measurements made per fish. Scale bars: 50 µm. Values are mean±s.e.m. |
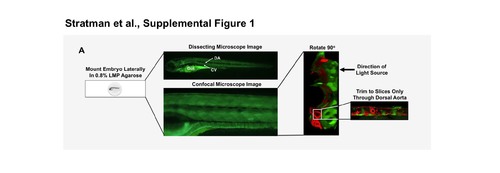
Mounting and imaging strategy of mural cell transgenic lines. (A) Embryos were mounted in 0.9% low melt point (LMP) agarose at the desired time point of imaging. Confocal stacks were acquired through the zebrafish at a 1.5 μM step size. Typically due to limitations of penetrance of lasers with confocal microscopy, one side of the embryo (the side closest to the light source) is imaged in greater detail. Excess slices from imaging are trimmed to only include the slices that include the dorsal aorta. It is key for trimming for the embryo to have been mounted as flat as possible. |
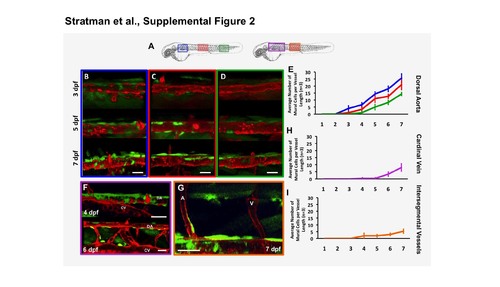
Time-course analysis and quantification of mural cell accumulation in different vascular beds. (A) Schematic representation of areas assessed for mural cell accumulation over time in the developing zebrafish. (B-E) Representative images of mural cell association with the dorsal aorta in sections proximal to the head (B, blue boxes and lines), mid-trunk (C, red boxes and lines), and in the tail region (D, green boxes and lines) at 3, 5 and 7 dpf. (E) Quantification of the number of mural cells associated with a four-somite length of dorsal aorta over time. Blue line is the quantification from the most proximal section to the head, red line is the quantification from mid-trunk section and the green line is quantification from the more distal tail region. (F,H) Representative images of mural cells associated with the cardinal vein at 4 and 6 dpf (F, purple boxes and lines), and quantification of the number of mural cells associated with a four-somite length of cardinal vein over time (H). (G,I) Representative image of mural cells associated with the intersegmental arteries at 7 dpf (G, orange boxes and lines), and quantification of the number of mural cells associated with a four-ISV length of the zebrafish trunk over time (I). Scale bars = 50 μm. Mean ± s.e.m. n=5 fish per region. |
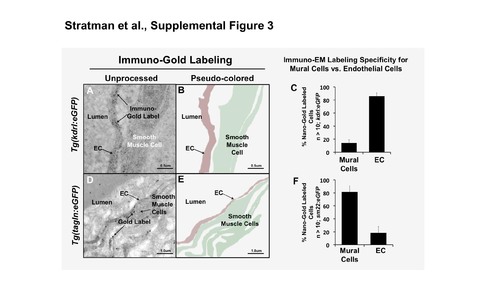
Immuno-EM confirms specificity of the tagln mural cell transgenic line. (A-C) Immuno-gold labeling of GFP of the Tg(kdrl:egfp) line shows specific labeling of the endothelium. (A) Low magnification and pseudo-colored interpretation of the endothelial (red) immuno-gold labeling. (B) Higher magnification of the endothelium shows more clearly the immuno-gold label. (C) Quantification of the number of immuno-gold labeled sites, showing that the labeling was largely endothelial specific. (D-F) Immuno-gold labeling of GFP of the Tg(tagln:egfp) line shows specific labeling of mural cells. (D) Low magnification and pseudo-colored interpretation of the mural cell (green) immuno-gold labeling. (E) Higher magnification of the mural cells shows more clearly the immuno-gold label outside of the endothelial cells lining the dorsal aorta. (F) Quantification of the number of immuno-gold labeled sites, showing that the labeling was largely mural cell specific. n = 10 image regions measured, regions collected from 2-3 individual fish. Scale bars = 0.5 or 1.0 μm as indicated. Mean ± s.e.m. |
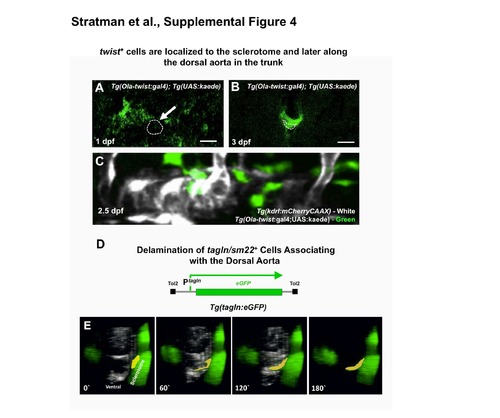
Expression and distribution of twist1+ cells during development coincides with delamination of tagln/sm22+ membrane from the sclerotome. (A,B) Confocal transverse view images of green unconverted kaede fluorescence in the mid-trunk of Tg(Ola-twist:gal4), Tg(uas:kaede) animals at 1 dpf (A) and 3 dpf (B). Twist+ cells are initially found in the sclerotome region of the somites (A), but later become concentrated around the vicinity of the dorsal aorta (B). Representative images were obtained from n = 3-5 fish; 2 rounds of immunostaining. (C) Confocal lateral view images of unconverted kaede (green) on a red fluorescent dorsal aorta (white) of a Tg(Ola-twist:gal4), Tg(uas:kaede), Tg(kdrl:mCherryCAAX) triple transgenic animal at 2.5 dpf. Images were obtained from 5 fish, from 2 separate experiments and a representative image chosen. (D) Schematic diagram of the Tg(tagln:egfp) transgene, with the transgelin (tagln) promoter driving expression of egfp in the cytoplasm. (E) Selected frames from a confocal time-lapse image series collected from a Tg(tagln:egfp) (in green); Tg(kdrl:mCherryCAAX) (in white) double-transgenic fish shows the movement of a tagln+ membrane (yellow) from the adjacent sclerotome delaminate and associate with the dorsal aorta. The image reconstructions shown are tilted ventral views, looking at a 45o upward tilted angle along the length of the dorsal aorta. Confocal images were acquired every 10 minutes and the displayed stills are shown at approximately 1-hour intervals. Scale bars = 50 μm. In total, 13 tagln+ cells investing the DA were traced to the sclerotome in 6 independent time-lapse experiments. |
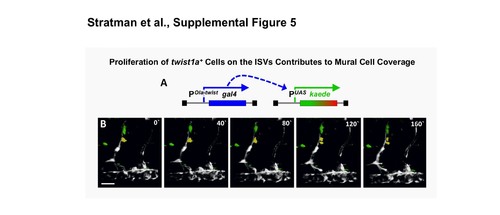
twist1+ cells proliferate to contribute to mural cell coverage. (A) Schematic diagram of the transgenes in Tg(Ola-twist:gal4), Tg(uas:kaede) double transgenic fish, in which the Medaka (Oryzias latipes) twist promoter (Ola-‐ twist) is used to drive expression of Gal4 from the Ola-twist:gal4 transgene, which then activates expression of green to red photoconvertible Kaede from the uas:kaede transgene. (B) Selected frames from a confocal time-lapse image series collected from a 2-2.5 dpf Tg(Ola-twist:gal4), Tg(uas:kaede) double-transgenic fish. Two twist1+ ISV- associated cells highlighted in yellow and green undergo cell division over the course of the time-lapse imaging experiment. The image reconstructions shown are lateral views of the mid-trunk, with rostral to the left. Confocal images were acquired every 10 minutes and the displayed stills are shown at approximately 40-minute intervals. Scale bars = 50 μm. Still images are representative of data collected from 3 individual time-lapse experiments. |
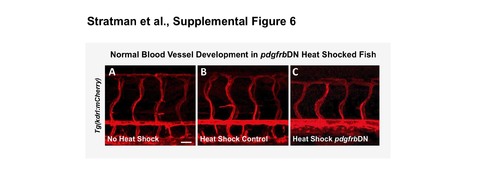
Activation of the pdgfrDN construct starting at 1 dpf does not lead to gross defects in vascular patterning. Confocal images of 5 dpf non-heat shocked triple transgenic Tg(kdrl:mCherry); Tg(hsp70:gal4); Tg(uas:pdgfrbdn-yfp) animals (A), heat shocked control Tg(kdrl:mCherry); Tg(hsp70:gal4) animals (B), or heat-shocked pdgfrbDN-expressing triple transgenic Tg(kdrl:mCherry); Tg(HSP70:gal4; UAS:pdgfrbDN-YFP) animals (C). Animals demonstrate no gross vascular patterning defects from either the heat shock process or activation of the pdgfrDN construct. Scale bars = 50 μm. n= 5 fish. |

Mural cell-autonomous inhibition of pdgfr signaling leads to loss of mural cell coverage on the zebrafish dorsal aorta. (A) Schematic diagram showing the Tg(tagln:EcRgal4) and Tg(uas:pdgfrbDN-YFP) transgenes used for heat shock-inducible expression of dominant negative PDGF receptor beta (pdgfrbDN). These fish were outcrossed to Tg(tagln:egfp) transgenic fish to generate triple heterozygotes, treated with tebufenozide for the indicated time frame, and imaged for analysis of mural cell coverage at 6 dpf. (B-G) Representative 6dpf images of untreated (B,D,F) or 0.5-6 dpf tebufenozide-treated (C,E,G) Tg(tagln:egfp), Tg(tagln:EcRgal4), Tg(uas:pdgfrbDN-YFP) triple-transgenic animals. Images show whole-animal transmitted light images (B,C), whole-animal green epifluorescence images of tagln:egfp green fluorescence (D,E), and higher-magnification confocal images of the dorsal aorta, showing green fluorescent EGFP-positive vSMC and red autofluorescent circulating red blood cells marking the vascular compartment (F,G). (H) Quantification of the percent number of mural cells covering the dorsal aorta with or without tebufenozide treatment and activation of dominant-negative pdgfrbDN. Fish were treated with the chemical as described above, imaged at 6 dpf and the number of tagln/sm22+ cells per three-somite segment length of dorsal aorta counted. The data represent the % number of tagln/sm22+ cells normalized to the control tebufenozide-treated condition (second column). n= 5 fish from a single experiment; 2 experimental replicates, 2 independent fish clutches per experiment. In more absolute values, we typically see approximately 20 ± s.e.m vSMCs recruit to a 3 somite segment of dorsal aorta under control conditions, and approximately 9-10 ± s.e.m vSMCs recruit to a 3 somite length of dorsal aorta under “DN” activation conditions. (I) Quantification of dorsal aorta (left columns, red) and posterior cardinal vein (right columns, blue) diameter, demonstrating markedly larger dorsal aorta in tebufenozide-treated Tg(tagln:egfp), Tg(tagln:EcRgal4), UAS:pdgfrbDN-YFP) triple- transgenic animals expressing pdgfrbDN autonomously in mural cells. No significant effects were noted on the diameter of the cardinal vein. 3-5 fish were measured per sample, with 10 separate dorsal aorta measurements per fish; experiment repeated twice with consistent results. Values were normalized to the tagln/sm22+ cell counts from non- tebufenozide-treated control fish (column 1). Mean ± s.e.m.; * = p ≤ 0.05 significance from control. Scale bars = 1 mm for B,C and 50 μm for F,G. |
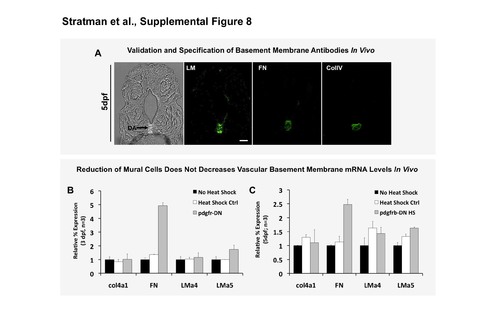
mRNA transcript levels of individual basement membrane components are not reduced. (A) Validation and demonstration of the antibodies utilized to show vascular enrichment of the basement membrane proteins analyzed throughout the manuscript. (B,C) qPCR analysis of mRNA transcript levels of individual basement membrane components. Fish were heat shocked starting at 1 dpf and collected at 3 dpf (B) and 5 dpf (C) for analysis. Data are normalized to ef1α and to no- heat shock controls (black columns). Data represents RNA collected from 15 pooled embryos. qPCR repeated in triplicate twice per sample, with 2 experimental replicates showing consistent results. Scale bars = 50 μm. Mean ± s.d. |
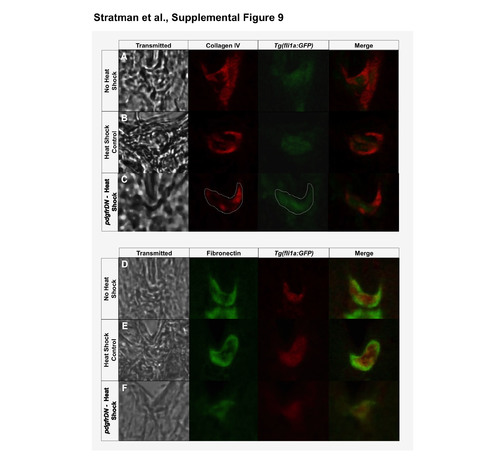
Co-staining of vascular and basement membrane proteins shows vascular enrichment. (A-C) Collagen IV with vascular co-immunostaining: column 1- transmitted light image of the region of interest; column 2- collagen IV immunolabeling (pseudocolored red); column 3- immunolabeling of GFP expressed by the Tg(fli1a:GFP) zebrafish line (pseudocolored green); column 4- merge of the collagen IV and vascular images. Three conditions were analyzed: No Heat Shock Controls (A), Heat Shock Controls (B), and pdgfrDN- Heat Shock (C). (D-F) Fibronectin with vascular co-immunostaining: column 1- transmitted light image of the region of interest; column 2- fibronectin immunolabeling (pseudocolored green); column 3- immunolabeling of GFP expressed by the Tg(fli1a:GFP) zebrafish line (pseudocolored red); column 4- merge of the collagen IV and vascular images. Three conditions were analyzed: No Heat Shock Controls (D), Heat Shock Controls (E), and pdgfrDN- Heat Shock (F). Representative images were chosed from 3 independent rounds of immunostaining. |