
- Title
-
Injections of Predatory Bacteria Work Alongside Host Immune Cells to Treat Shigella Infection in Zebrafish Larvae
- Authors
- Willis, A.R., Moore, C., Mazon-Moya, M., Krokowski, S., Lambert, C., Till, R., Mostowy, S., Sockett, R.E.
- Source
- Full text @ Curr. Biol.
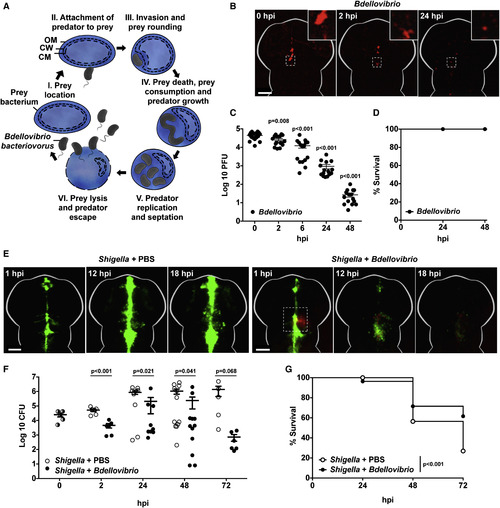
Injected Predatory Bdellovibrio Persist in Zebrafish Larvae without Ill Effects and Protect against Shigella Infection In Vivo (A) Cartoon of Bdellovibrio life cycle. (I–III) Motile predatory Bdellovibrio attach to and invade the periplasm of Gram-negative bacteria such as Shigella. (III) Prey bacteria are rounded by DD-endopeptidase action on the cell wall. (IV) Prey bacteria are killed in ∼30 min and kept intact as Bdellovibrio consume their contents and grow. (V and VI) Following replication, Bdellovibrio lyse prey 180–240 min after invasion, releasing further predators. These Bdellovibrio progeny can repeat the predatory cycle. OM, outer membrane; CW, cell wall peptidoglycan; CM, cytoplasmic membrane. (B) Wild-type (WT) AB larvae were injected at 3 dpf in the hindbrain ventricle with 1–10 × 104 PFUs of mCherry-Bdellovibrio (red). The same larvae were imaged over time to observe distribution. Representative images from a single larva are shown here. Scale bar, 100 μm. (C) Enumeration of live Bdellovibrio in PBS-homogenates from larvae injected with mCherry-Bdellovibrio as in (B) over time. Each circle represents a count from an individual larva. Data are pooled from two independent experiments (n = 8 larvae per experiment). Mean ± SEM (horizontal bars) is shown. The p values (versus the 0 hpi time point) were determined by multiple t test. Significance with Bonferroni correction was defined as p < 0.0125. See also Figures S1B–S1D for comparative evaluations of Bdellovibrio persistence from different doses in larvae at different developmental stages. (D) Survival curve of WT AB larvae injected with mCherry-Bdellovibrio as in (B) and incubated at 28°C for 48 hpi. Data are pooled from three independent experiments (n = 22–37 larvae per experiment). (E) WT AB zebrafish larvae were injected in the hindbrain ventricle at 3 dpf with >5 × 10³ CFUs of GFP-S. flexneri (green), followed by a hindbrain injection of either PBS or 1–2 × 10⁵ PFUs of mCherry-Bdellovibrio (red), 30–90 min after the initial Shigella infection. Representative images of the hindbrain ventricle in PBS- or Bdellovibrio-treated zebrafish larvae infected with Shigella are shown. Dotted square shows region of interaction between fluorescent Shigella and Bdellovibrio. For each treatment, the same larva was imaged over time. Scale bar, 100 μm. See also Movie S1. (F) Enumeration of live Shigella in homogenates of larvae injected with S. flexneri and treated with injections of either PBS or Bdellovibrio as in (E) over time. Each circle represents a count from an individual larva. Half-filled circles represent enumerations from larvae at time 0 and are representative of inocula for both conditions. Only viable larvae were included in the analysis. Data are pooled from four independent experiments (up to n = 3 larvae per time point per experiment). Mean ± SEM (horizontal bars) is shown. The p values (between conditions at cognate time points) were determined by unpaired one-tailed Student’s t test. Significance was defined as p < 0.05. (G) Survival curve of larvae injected with S. flexneri and treated with either PBS or Bdellovibrio as in (E). Larvae were incubated at 28°C for 72 hpi. Data are pooled from three independent experiments (n = 22–48 larvae per condition per experiment). Up to three larvae per condition were taken for CFUs at 2, 24, 48, and 72 hr time points. The p value between conditions was determined by log-rank Mantel-Cox test. Significance was defined as p < 0.05. See also Figure S1. |
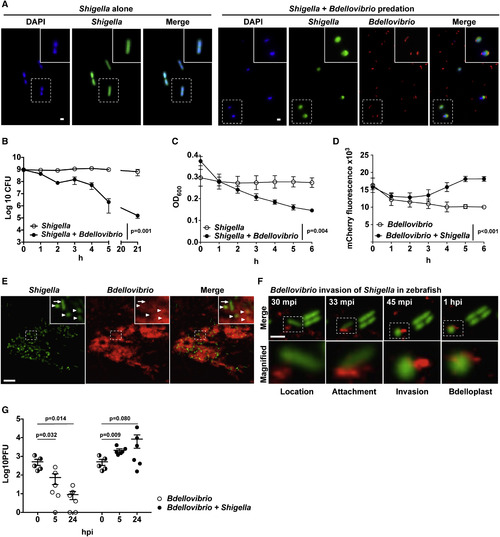
Bdellovibrio Prey on Shigella In Vitro and In Vivo inside Living Zebrafish (A) GFP-S. flexneri (green) were incubated in vitro, in the presence or absence of mCherry-Bdellovibrio (red), and visualized by wide-field fluorescent microscopy. Representative images, including rod-shaped Shigella and rounded Shigella invaded by smaller comma-shaped Bdellovibrio, were taken at 1 hr post-mixing. Scale bar, 1 μm. (B) 5–12 × 108 CFUs of GFP-S. flexneri were incubated, in vitro, in 10 mL CaHEPES buffer for 21 hr in the presence or absence of ∼6.2 × 10¹⁰ PFUs of mCherry-Bdellovibrio. Live Shigella were enumerated over time. Data are pooled from three independent experiments. Mean ± SEM (horizontal bars) is shown. The p value between conditions was determined by paired one-tailed Student’s t test. Significance was defined as p < 0.05. (C and D) 2–7 × 10⁷ CFUs of GFP-S. flexneri, 8.4–10.4 × 10⁹ PFUs of mCherry-Bdellovibrio, or both GFP-S. flexneri and mCherry-Bdellovibrio were incubated in vitro in CaHEPES buffer at 37°C. (C) Optical density 600 (OD600) representing Shigella numbers (Bdellovibrio are too small to contribute to OD600) or (D) mCherry fluorescence intensity representing Bdellovibrio numbers was measured every 30 min for 6 hr using a microplate reader (results plotted every 1 hr). Mean ± SEM from three biological replicates with three technical replicates each is shown. The p value between conditions was determined by paired one-tailed Student’s t test. Significance was defined as p < 0.05. (E) WT AB zebrafish larvae were injected at 3 dpf in the tail muscle with 103 CFUs of GFP-S. flexneri (green) followed by a tail muscle injection of 1–2 × 10⁵ PFUs of mCherry-Bdellovibrio (red) 30–90 min after the initial Shigella infection. Larvae were imaged by confocal microscopy at 20× magnification. Representative images show the different morphologies of Shigella in vivo, including the typical rod-shaped Shigella (arrow) and also a high proportion of rounded Shigella (arrowheads) at regions of interaction with Bdellovibrio. Scale bar, 10 μm. (F) Representative images of predation of Shigella by Bdellovibrio in vivo, inside a larva injected as in (E) and imaged by high-resolution confocal microscopy at 63× magnification. Frames captured over time show stages of Bdellovibrio (red) invasive predation and rounding of Shigella (green) in vivo. Scale bar, 2.5 μm. mpi, minutes post-infection. See also Movie S2. (G) WT AB zebrafish larvae were injected in the hindbrain ventricle at 3 dpf with 2–6 × 10⁵ CFUs of GFP-S. flexneri (green) alone or followed by a hindbrain injection of 1–30 × 102 PFUs of mCherry-Bdellovibrio (red) 30–90 min after the initial Shigella infection. Bdellovibrio were diluted 100-fold from usual injections to facilitate enumeration of any replicated predators. Enumeration of live Bdellovibrio in PBS-treated homogenates of larvae over time is shown. Each circle represents a count from an individual larva. Half-filled circles represent enumerations from larvae at time 0 and are representative of inocula for both conditions. Only viable larvae were included in the analysis. Data are pooled from two independent experiments (up to n = 3 larvae per time point per experiment). Mean ± SEM (horizontal bars) is shown. The p values (versus the 0 hpi time point) were determined by multiple t test. Significance with Bonferroni correction was defined as p < 0.0125. Of note, p values (not displayed on figure) between conditions at cognate time points were determined by unpaired one-tailed Student’s t test with significance defined as p < 0.05. These are as follows: p < 0.001 between conditions at 5 hr and p < 0.0852 at 24 hr. |
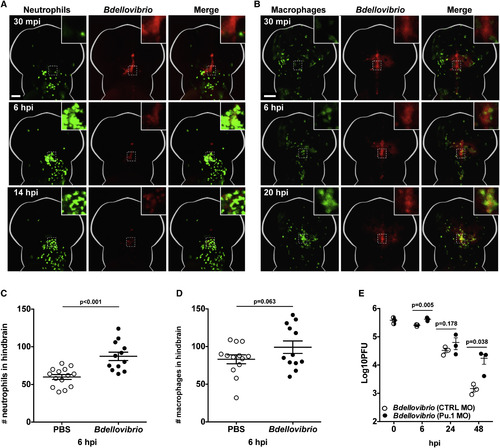
Bdellovibrio Is Recognized and Engulfed by Zebrafish Leukocytes In Vivo (A) 1–2 × 10⁵ PFUs of mCherry-Bdellovibrio were injected into the hindbrain ventricle of Tg(mpx:GFP)i114 zebrafish larvae at 3 dpf, and interactions between neutrophils (green) and Bdellovibrio (red) were visualized by fluorescent stereomicroscopy. Representative images from a single larva over time are shown. Scale bar, 100 μm. See also Movie S3. (B) 1–2 × 10⁵ PFUs of mTeal-Bdellovibrio were injected into the hindbrain ventricle of Tg(mpeg1:Gal4-FF)gl25/Tg(UAS-E1b:nfsB.mCherry)c264 zebrafish larvae at 3 dpf, and interactions between macrophages (green) and Bdellovibrio (red) were visualized by fluorescent stereomicroscopy. Representative images from a single larva over time are shown. Scale bar, 100 μm. See also Movie S3. (C) Tg(mpx:GFP)i114 zebrafish larvae were injected with PBS or Bdellovibrio as in (A), and GFP-expressing neutrophils present in the head region were quantified at 6 hpi. Each circle represents a count from an individual larva. Data are pooled from two independent experiments. The p value between conditions was determined by unpaired one-tailed Student’s t test. Significance was defined as p < 0.05. (D) Tg(mpeg1:Gal4-FF)gl25/Tg(UAS-E1b:nfsB.mCherry)c264 zebrafish larvae were injected with PBS or Bdellovibrio as in (B), and mCherry-expressing macrophages present in the head region were quantified at 6 hpi. Each circle represents a count from an individual larva. Data are pooled from two independent experiments. The p value between conditions was determined by unpaired one-tailed Student’s t test. Significance was defined as p < 0.05. (E) Tg(mpx:GFP)i114 zebrafish larvae were pre-treated using control (CTRL) or Pu.1-targeting morpholino (MO) to deplete leukocytes. Morphants were injected in the hindbrain ventricle at 3 dpf with either PBS or 3–5 × 10⁵ PFU mCherry-Bdellovibrio. Live Bdellovibrio were enumerated from PBS homogenates of larvae. Each circle represents a count from an individual larva. Half-filled circles represent enumerations from larvae at time 0 and are representative of inocula for both conditions. Mean ± SEM (horizontal bars) is shown. The p value (between conditions at cognate time points) was determined by unpaired one-tailed Student’s t test. Significance was defined as p < 0.05. As inoculums from independent experiments were variable up to a log-fold, a representative of three independent experiments performed is shown. See also Figure S2E. See also Figure S2. |
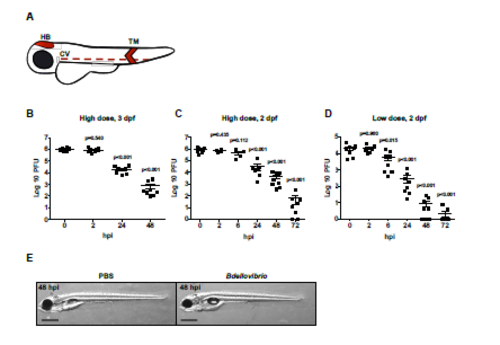
Injected Predatory Bdellovibrio Persist in Zebrafish Larvae and are Ultimately Cleared, Related to Figure 1 (A) Zebrafish larvae were injected with bacteria or PBS in either the hindbrain ventricle (HB), tail muscle (TM) or caudal vein (CV) shaded in red. Injections in the hindbrain were performed to study population level dynamics of Bdellovibrio, Shigella and/or leukocytes. Injections in the tail muscle were performed to enable highresolution confocal microscopy. (B–D) WT AB zebrafish larvae were injected with (B-C) a high dose of Bdellovibrio or (D) a low dose of Bdellovibrio at (B) 3 dpf or (C-D) 2 dpf in the hindbrain ventricle. Live Bdellovibrio were enumerated from larval homogenates at time points indicated. Each circle represents a count from an individual larva. Mean ± SEM (horizontal bars) are shown. (B) Data pooled from 2 independent experiments using 3-4 larvae per time point. (C) Data from 2 independent experiments using 4 larvae per time point. p values (versus the 0 hpi time point) determined by multiple t-test. Significance with Bonferroni correction defined as p<0.017 for (B), p<0.01 for (C-D). (E) WT AB zebrafish larvae were injected in the hindbrain at 3 dpf with PBS or 1-2 x 10⁵ PFU of Bdellovibrio and imaged via stereomicroscopy at 48 hpi (i.e. 5 dpf). Representative images of larval morphology are shown. Scale bar = 0.5 mm. |
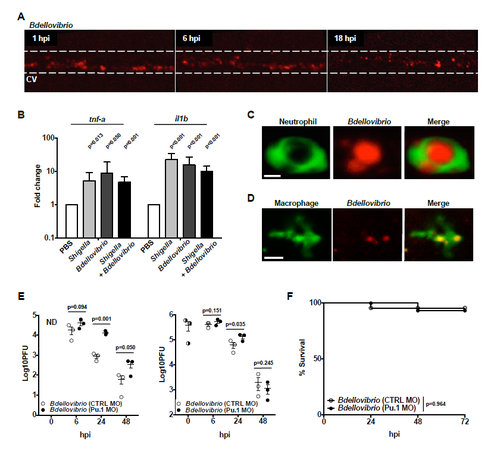
Characterisation of the Innate Immune Response to Bdellovibrio In Vivo, Related to Figure 3 (A) 1-2 x 10⁵ PFU of mCherry-Bdellovibrio (red) were injected into the caudal vein of WT AB zebrafish larvae at 3 dpf and imaged at the stereomicroscope. The same larva was imaged over time. The area inside the white dashed line indicates the blood stream. CV, caudal vein. (B) WT zebrafish larvae were injected with: PBS, >5 x 10³ CFU of S. flexneri, 1-2 x10⁵ PFU of Bdellovibrio or co-injected with the above doses of S. flexneri and Bdellovibrio, sequentially. RNA was extracted from pools of 5 larvae and (2 technical replicates for each of 3 biological repeats for tnf-a, 2 technical replicates for each of 4 biological repeats for il1b; normalised to PBS). Expression of il1b and tnf-a mRNA transcripts was determined by qRT-PCR. p values (versus PBS control) determined by unpaired 1-tailed Student’s t-test. Significance defined as p<0.05. (C) 1-2 x 10⁵ PFU of mCherry-Bdellovibrio were injected into the tail muscle of Tg(mpx:GFP)i114 zebrafish larvae at 3 dpf and single-cell interactions between Bdellovibrio (red) and neutrophils (green) visualised by high-resolution confocal microscopy at 100x magnification. A representative image is shown. Scale bar = 5 μm. See also Movie S4. (D) 1-2 x 10⁵ PFU of mTeal-Bdellovibrio were injected into the tail muscle of Tg(mpeg1:Gal4-FF)gl25/Tg(UAS-E1b:nfsB.mCherry)c264 zebrafish larvae at 3 dpf and single-cell interactions between Bdellovibrio (red) and macrophages (green) visualised by high-resolution confocal microscopy at 63x magnification. A representative image is shown. Scale bar = 10 μm. See also Movie S4. (E) Tg(mpx:GFP)i114 zebrafish larvae were pre-treated using control (CTRL) or Pu.1- targeting morpholino (MO) to deplete leukocytes. Morphants were injected at 3 dpf with either PBS or 0.1-6 x 10⁵ PFU of mCherry-Bdellovibrio. Live Bdellovibrio were enumerated from PBS homogenates of larvae. Each circle represents a count from an individual larva. Half-filled circles represent enumerations from larvae at time 0 and are representative of inocula for both conditions. Mean ± SEM (horizontal bars) are shown. p values (between conditions at cognate timepoints) determined by multiple t-test. Significance with Bonferroni correction defined as p<0.017. As inocula from independent experiments were variable up to a log-fold (PFU counting of predators necessarily performed post experiment), representatives of 3 independent experiments performed are shown. See also Figure 3E. (F) Survival curve of Tg(mpx:GFP)i114 zebrafish larvae injected with control (CTRL) or Pu.1-targeting morpholino (MO) and then injected at 3 dpf with either PBS or 1-2 x 10⁵ PFU of mCherry-Bdellovibrio. Larvae were incubated at 28°C for 72 hpi. Data pooled from 2 independent experiments using n = 21-26 larvae per treatment per experiment. Up to 3 larvae per condition were taken for CFU at 24 and 48 hr timepoints. Mean ± SEM (horizontal bars) are shown. p value between conditions determined by log rank Mantel-Cox test. Significance defined as p<0.05. |
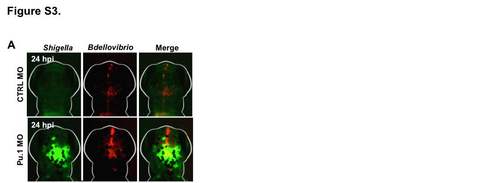
Bdellovibrio Work Alongside Innate Immune Cells to Protect Against Shigella Infection In Vivo, Related to Figure 4 (A) WT AB zebrafish larvae were injected with control (CTRL) or Pu.1-targeting morpholino (MO). Morphants were injected at 3 dpf in the hindbrain ventricle with > 5 x 10³ of GFP-S. flexneri and treated with injection of 1-2 x 10⁵ PFU of mCherry- Bdellovibrio 30-90 min after initial injection. Representative images of bacteria in the hindbrain ventricle in CTRL or Pu.1 morphants are shown. |