
- Title
-
In vivo characterization of hair and skin derived carbon quantum dots with high quantum yield as long-term bioprobes in zebrafish
- Authors
- Zhang, J.H., Niu, A., Li, J., Fu, J.W., Xu, Q., Pei, D.S.
- Source
- Full text @ Sci. Rep.
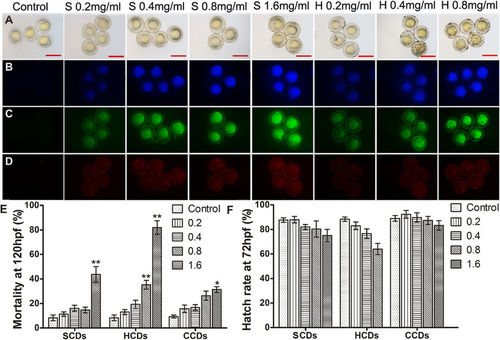
The fluorescent imaging of CDs in zebrafish and biocompatibility of CDs. (A–D) Fluorescent microscopic images of bright field and fluorescent field (B blue, C green, and D red) of zebrafish embryos at 24 hpf after exposure to different concentrations of SCDs and HCDs. Scale bars, 1000 μm. (E,F) Effects of exposure concentration of SCDs, HCDs and CCDs on zebrafish mortality at 120 hpf and hatch rate at 72 hpf (n = 50). Single asterisk (*) indicated significant difference compared to control at P < 0.05, and double asterisks (**) indicated significant difference, compared to control at P < 0.01. Values represented the mean ± standard error (SE) of three replicates. |
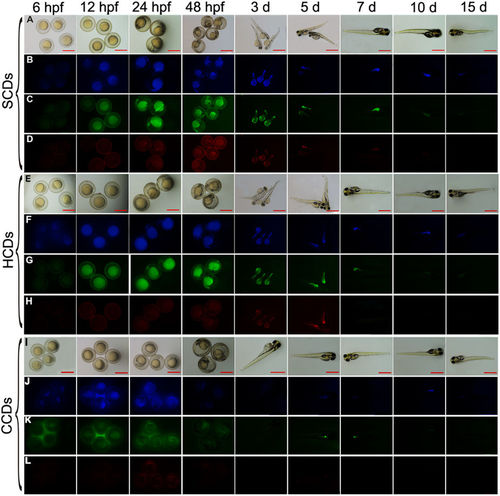
The photoluminescence decay of CDs in zebrafish. The fluorescent microscopic images of bright field and fluorescent field of zebrafish embryos after exposure to 0.4 mg/mL HCDs, SCDs and CCDs solutions for 2 days at different time points. Scale bars, 1,000 μm. |
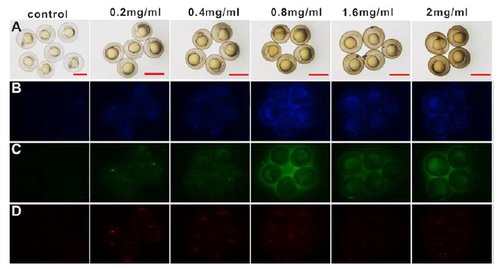
Biocompatibility detection of CCDs in zebrafish embryos at 24 hpf. Fluorescent microscopic images were captured in brightfield (A) and fluorescent field (B blue; C green; D red) after embryos exposure to different concentration of CCDs for 20 h. Scale bars, 1000 μm. |
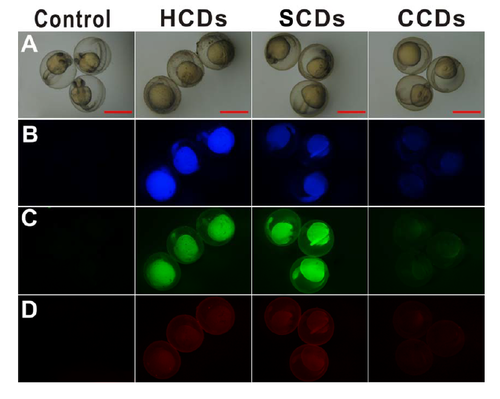
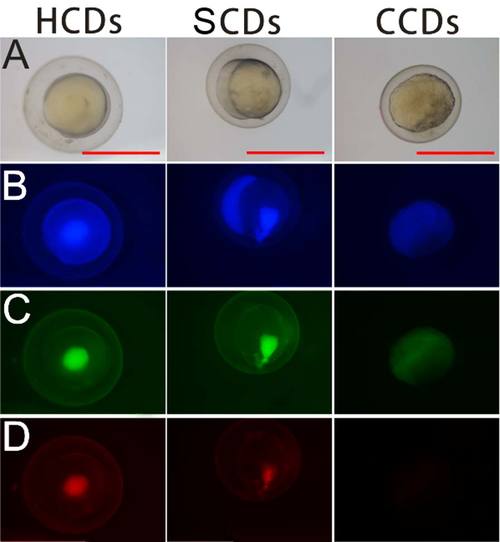
Biocompatibility detection of three CDs in zebrafish embryos at 48 hpf. Fluorescent microscopic images were captured in bright field (A) and fluorescent field (B blue; C green; D red) after embryos exposure to 0.4 mg/ml different CDs for 44 h. Scale bars, 1000 μm. |
Biocompatibility detection of three injected CDs in zebrafish embryos during the cleavage period. Fluorescent microscopic images were captured in bright field (A) and fluorescent field (B blue; C green; D red) after embryos injected different CDs for 30 min. Scale bars, 1000 μm. |
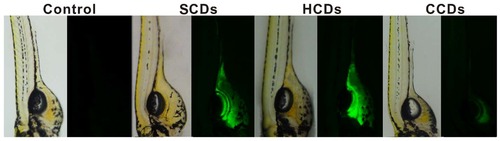
Biocompatibility detection of CDs in zebrafish embryos at 10 dpf. Fluorescent microscopic images were captured in bright field (upper row) and fluorescent field (middle row and lower row) after embryos exposure to CDs for 2 d. (A) control; (B) HCDs; (C) SCDs; (D) CCDs. Scale bars, 1000 μm. |
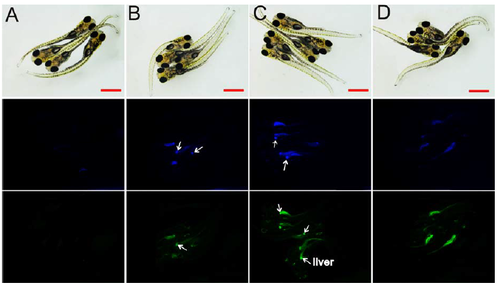
The fluorescence distribution of CDs in zebrafish larvae at 5 dpf. Thefluorescent images were captured in brightfield (left) and fluorescent field (right) after embryos exposure to CDs solutions for 116 h. |
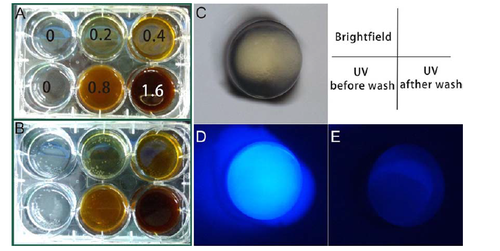
Schematic diagram of CDs exposure to zebrafish. (A) Preparation of different concentrations of CDs; (B) Exposure zebrafish embryos to CDs; (C-E) The fluorescent microscopic images of zebrafish embryos in brightfield and fluorescent field under UV light before and after washed. It indicates that the washing process is essential before taking fluorescent images. |