
- Title
-
Cellular requirements for building a retinal neuropil
- Authors
- Randlett, O., MacDonald, R.B., Yoshimatsu, T., Almeida, A.D., Suzuki, S.C., Wong, R.O., Harris, W.A.
- Source
- Full text @ Cell Rep.

BC Axons Overshoot and Retract to Colonize the Nascent IPL (A) Schematic showing the general organization of the vertebrate retina, including the neuropil layers, the IPL and OPL, and the retinal neurons and glia that will synapse within them. (B) An individual BC labeled by MAZe;UAS:mYFP transgenes. The distal process extends to the basal surface (dashed line) of the retina. Branching into the IPL region can be seen, and the distal portion of the axon retracts to this point (arrow). At the same time, the apical process is also retracted from the apical surface of the retina. (C) Transplantation scheme to create mosaic retinas with clones of vsx1:GFP-expressing BCs and ptf1a:DsRed-expressing ACs in an unlabeled host retina. At the onset of imaging, ptf1a:DsRed-expressing ACs and HCs have migrated to the AC layer. However, a separation between the dACs and ACs is not apparent. Over time, the BC axons appear (arrows) and begin to stratify in between the ptf1a:DsRed-expressing cells. As these BC axons elaborate, the ACs are separated into displaced and nondisplaced populations that are parted by the expanding IPL. Images are confocal reconstructions. (D) Transplantation scheme to create mosaic embryos with vsx1:GFP-expressing BCs in a host retina where RGCs and ACs are labeled by ath5:GAP-RFP. BC axons (arrows) accumulate coincidentally with the appearance of the IPL, as shown by ath5:GAP-RFP-labeled RGCs and ACs (dashed line). Images represent maximum intensity projections of nine confocal slices. Time shown in hr:min. Imaging begins at ∼40 hpf. Scale bars = 10 μm. GCL, ganglion cell layer; INL, inner nuclear layer; NFL, neurofiber layer; OLM, outer limiting membrane; ONL, outer nuclear layer. See also Figure S1 and Movies S1, S2, and S3. |
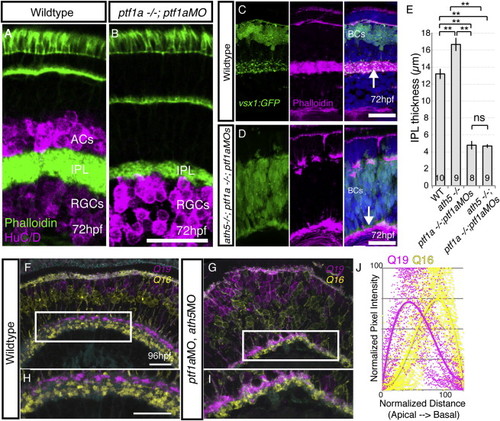
Simultaneous Removal of BC Partner Neurons (RGCs and ACs) Does Not Prevent BC Axons from Forming a Sublaminated Neuropil (A and B) Despite the loss of ACs, a phalloidin-rich IPL forms in the ptf1a−/−;ptf1aMO retina. (C) WT retina with the actin-rich IPL shown by phalloidin (arrow) and BC terminals labeled with vsx1:GFP. (D) Phalloidin staining demonstrates that in the AC/RGC-free retina (ath5−/−;ptf1a−/− ;ptf1aMO), the IPL is actin rich and positioned along the basal surface of the retina (arrow). (E) The thickness of the IPL was measured for each genotype at 5 dpf, demonstrating it is significantly thinner after AC removal (ptf1a−/−;ptf1aMOs), and thicker after RGC removal (ath5−/−). One-way ANOVA and Tukey post hoc tests; ∗∗p < 0.01; error bars ± 1 SEM. The number of retinas measured is given within the bars. (F) In the WT retina, Q16-labeled BCs stratify basally to Q19-labeled BCs in the IPL. (G) After the removal of many ACs and RGCs by ptf1aMO and ath5MO injections (G), the typical Q16-basal, Q19-apical pattern is apparent in many areas. (H) Inset in (F). (I) Inset in (G). (J) Line intensity profile measurements from 45 regions (three different retinas/animals) demonstrates the basal enrichment of Q16 signal and apical enrichment of Q19 signal in ath5;ptf1a morphants. Scale bars, 20 μm. See also Figures S2 and S3. EXPRESSION / LABELING:
PHENOTYPE:
|
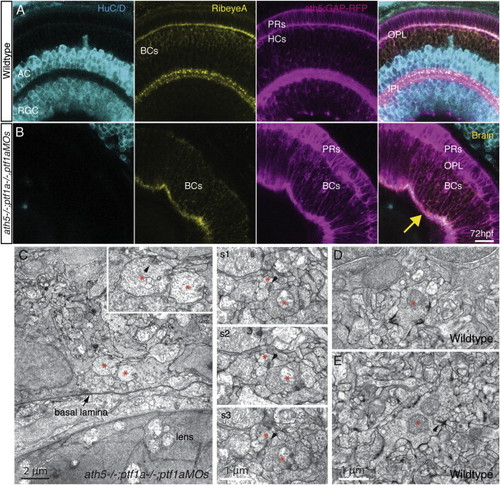
BC Axons Form Presynaptic Structures without Postsynaptic Neurons (A) WT ath5:GAP-RFP retinas stained with anti-HuC/D (to label ACs/RGCs) and anti-RibeyeA (to label ribbon synapses). Obvious punctate RibeyeA staining is visible in the IPL, whereas weak staining is seen in the BC cell bodies in the apical half of the INL and the OPL. (B) When ACs and RGCs are absent in the ath5:GAP-RFP;ath5−/−;ptf1a−/−;ptf1aMO embryos, the weakly RibeyeA-staining BC cell bodies span the entire INL, and punctate RibeyeA staining is visible in the BC-only IPL. Scale bar in (A) and (B), 10 μm. (C) Examples of vesicle-filled bouton-like structures (asterisks) containing ribbons near the retinal basal lamina of animals with severely reduced numbers of ACs and RGCs. Left: Higher magnification of the two such structures, presumed to be BC axonal boutons (arrowhead) shown in the inset. Right: Three consecutive sections (s1–s3) of processes in basally located neuropil in another animal. Arrows indicate ribbons juxtaposed to appositions with other processes, one of which can be another BC terminal (s1–s3). (D and E) WT BC synapses exhibit readily apparent postsynaptic densities (thickenings, arrow) that are not seen in the mutant/morphant plexus (s1–s3). EXPRESSION / LABELING:
PHENOTYPE:
|
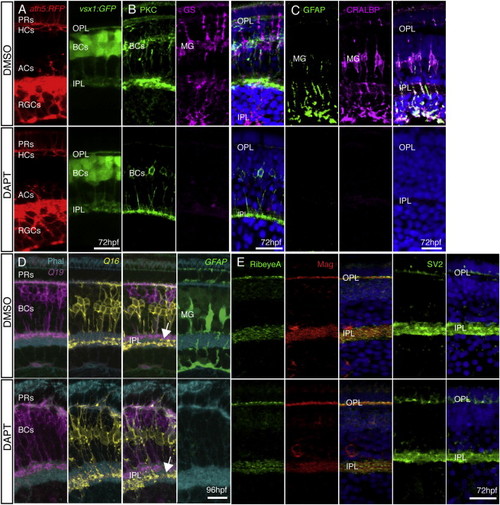
MG Are Not Required for Retinal Organization or Plexiform Layer Development (A) ath5:GAP-RFP and vsx1:GFP show that all neural retinal cell types are present and correctly positioned in DMSO-treated control embryos and after DAPT treatment. (B and C) Treatment with DAPT at 33 hpf completely removed MG in the retina. PKC staining is unperturbed by DAPT treatment, indicating BC differentiation is unaffected. However, DAPT-treated embryos show a complete loss of MG when stained with specific markers for GS, CRALBP, and GFAP when compared with DMSO controls. (D) The IPL forms and sublaminates properly in the absence of MG. nyx:Gal4; UAS:MYFPQ16, and vsx1:MCeruleanQ19 fish show labeling of specific subsets of BCs that stratify in the apical (OFF) or basal (ON) domains of the IPL. Imaging of triple transgenics Q16;Q19;gfap:GFP treated with DAPT shows that the IPL still forms and BC axons sublaminate properly (arrow). Lack of gfap:GFP signal confirms that there are no MG in the areas of proper sublamination. (E) Pre- and postsynaptic markers remain in the plexiform layers lacking MG. Staining for the presynaptic markers RibeyeA and SV2 and the postsynaptic density protein Maguk (Mag) is unperturbed in embryos lacking MG at 72 hpf. Scale bars, 10 μm (A and D) and 20 μm (B, C, and E). EXPRESSION / LABELING:
PHENOTYPE:
|
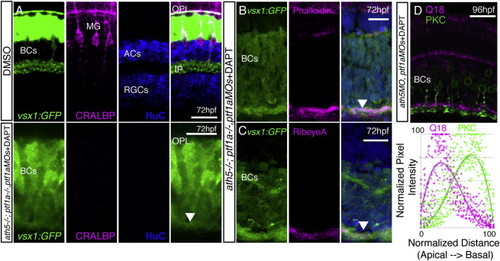
BC Axons Can Form a Sublaminated Neuropil in the Absence of Partner Neurons and Glia (A–C) A neuropil layer (arrowhead) forms at the basal surface of a cellularly simplified retina ath5−/−;ptf1a−/−;ptf1aMOs treated with DAPT, lacking ACs, HCs, RGCs, and MG (A). The neuropil layer is actin rich (B) and contains RibeyeA positive staining at 72 hpf (C). (D) Gross sublaminar structure is maintained in cellularly simplified retinas, with Q19 apical to the PKC staining in the IPL-like layer. This sublamination was statistically significant (p = 6.22 × 10−44, n = 3 sections). Scale bars, 10 μm (A, D, and E) and 20 μm (B, C, F, G, H, and I). EXPRESSION / LABELING:
PHENOTYPE:
|
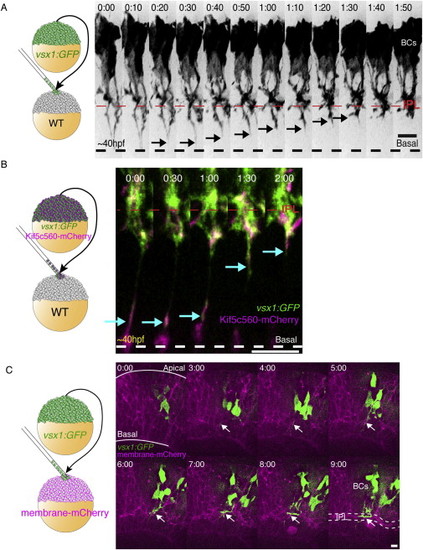
BC Axons Colonize the Nascent IPL at Approximately the Same Time as Other Retinal Cell Types, Related to Figure 1 (A) Transplantation scheme to create mosaic embryos with vsx1:GFP-labeled BCs in a WT host. BCs initially display a long process extending to the basal surface of the retina (dashed line). As development progresses, the distal portions of the basal processes retract (arrowheads) and the BC axons collect, condense and branch directly into the IPL. (B) Transplantation scheme to create mosaic embryos mosaic embryos with Kif5c560-mCherry and vsx1:GFP co-expressing BCs within a WT host retina. We observe bright Kif5c560-mCherry signal visible within retracting BC process (arrows). Time given in hr:min. Time-lapse imaging begins at 40-45hpf. (C) Transplantation scheme to create mosaic retinas with clones of vsx1:GFP expressing BCs within a membrane-mCherry labeled retina. The IPL becomes visible in the mCherry channel as a wavy band (t = 3:00), which thickens and condenses into the IPL (dotted line, t = 9:00). The GFP-expressing BC axons are visible within the nascent IPL (arrows), and elaborate as the IPL matures. Scale bars = 10 μm. |
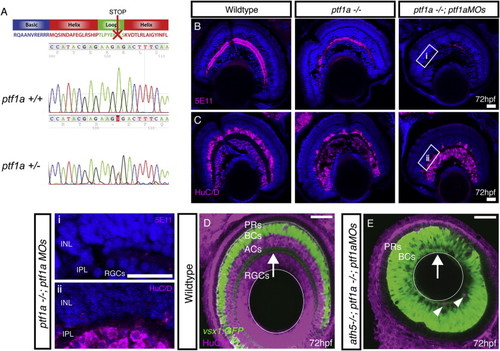
Elimination of ACs through Ptf1a Disruption, Related to Figure 2 (A) The ptf1asa126 mutation is an A to T conversion, which results in a non-sense mutation at amino acid 126 of 265. This results in a truncation within the loop of the basic helix-loop-helix DNA binding domain. (B and C) Immunostaining of retinal cryosections using (B) 5E11 to stain AC neurites and (C) anti-HuC/D to stain RGC and AC cell bodies, indicates that some ACs remain in homozygous ptf1a−/− mutants. Injection of ptf1a morpholinos into ptf1a−/− mutants, causes a further reduction in ACs numbers, where large stretches of retina lack 5E11 staining and HuC/D positive cells in the AC layer (higher magnification inserts given in: i, and ii). (D) WT retina with the vsx1GFP labeling BC axons in the IPL (arrow) and ACs/RGCs labeled with HuC/D. (E) In the ath5−/−;ptf1a−/−; ptf1aMO, AC/RGC-free retina, the IPL is positioned along the basal surface of the retina (arrow). Few remaining ACs shown with arrowheads. |
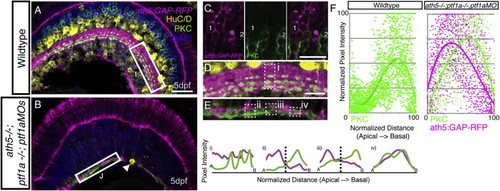
BC Axons Can Form a Sublaminated Neuropil in the Absence of Partner Neurons, Related to Figure 2 (A) Cryosections from 5 dpf ath5:GAP-RFP transgenic stained with anti-PKC (labeling ON-BCs) and HuC/D (labeling RGCs and ACs). (B) ath5−/−ptf1a−/−;ptf1a MO retinas lack HuC/D positive RGCs and ACs (remaining AC - arrowhead), but an ath5:GAP-RFP/PKC-labeled IPL still forms. (C) In the ath5:GAP-RFP;ath5−/−ptf1a−/−;ptf1a MO retinas, the ath5:GAP-RFP label is expressed by a subpopulation of BCs in the INL, which are distinct from the population of BCs labeled by the anti-PKC (cell #1 is ath5:GAP-RFP-positve, while cell #2 is PKC-positive). (D) Higher magnification inset of the WT IPL showing the targeting of PKC axon terminals to 3 sublaminae in the basal half of the IPL. This is shown quantitatively by three peaks in the line intensity profile in region (i). (E) The AC/RGC-free IPL shows some degree of disorganization. Yet, in some areas the PKC signal clearly segregates basal to the ath5:GAP-RFP signal in a stratified pattern (ii and iii). In other areas this is not the case (iv). (F) Line intensity profiles were normalized for intensity of relative apical/basal position along the IPL, and plotted as a single graph. This demonstrates the basal accumulation of PKC-labeled axons typical of the WT retina (n = 30 measurements, from 10 sections), as well and the basal enrichment of the PKC signal and the apical enrichment of the ath5:GAP-RFP signal in the ath5:GAP-RFP;ath5−/−ptf1a−/−;ptf1a MO retinas (n = 54 measurements, from 18 sections), are is reflected in the shift of the trendline. Note that ath5:GAP-RFP signal quantification is not shown for WT, as this transgene is expressed by RGCs and ACs in this context. |