
- Title
-
The Morphogenesis of Cranial Sutures in Zebrafish
- Authors
- Topczewska, J.M., Shoela, R.A., Tomaszewski, J.P., Mirmira, R.B., Gosain, A.K.
- Source
- Full text @ PLoS One

Developmental stages of zebrafish calvaria. (A) At 6 mm SL, ossification of the supraoccipital bone becomes visible as indicated by the black arrow; frontal bones are not detected yet. The cartilaginous epiphyseal bar is indicated by red arrow. (B) The frontal bones at 7.5 mm SL are outlined by the black dashed line. The supraoccipital bone is indicated by a black arrow in sections A-D. (C) At 8 mm SL, the frontal bones grow along the epiphyseal bar (red arrow) toward the midline, the parietal bones become visible as small radial patches symmetrically located on both sides of the cranium (outlined by the yellow dashed line). (D) At the 11 mm SL stage, the anterior part of interfrontal suture is developed (green arrow); frontal and parietal bones meet at the lateral side (black arrow head), initiating coronal suture formation, which progresses bilaterally toward the midline (purple arrow). The presumptive lambdoid suture develops between the parietal and supraoccipital bones (green arrowhead). (E) At 13 mm SL, all sutures are formed: the interfrontal (green arrow), coronal (black arrowhead), and sagittal suture (red arrowhead) and lambdoid (green arrowhead); the area specified by the black dotted line exemplify the measured area for morphometric study of the interfrontal suture. (F) Adult zebrafish cranium at age eight months, 26 mm SL. The black and yellow dashed lines indicate frontal and parietal bones respectively; the coronal and sagittal sutures are indicated by black and purple arrowheads respectively. (A, B) lateral view of the head; (C-F) Dorsal view of dissected calvaria stained with Alizarin red and Alcian blue. F–frontal bone, P–parietal bone, SOP–supraoccipital bone. |
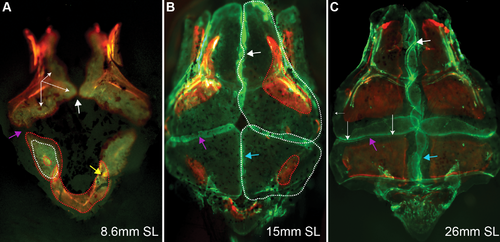
The growth pattern of calvaria bones as revealed by sequential staining with Alizarin red and Calcein green. (A) Initial directions of frontal bone growth (white arrows) and radial growth of the parietal bone are depicted after each vital staining by red and white dotted lines. The supraoccipital bone is depicted by the red dotted line. (B-C) The white, blue and purple arrows indicate developing sutures: interfrontal, sagittal and coronal, respectively. (B) The contour of frontal and parietal bones growth is outlined by red dotted lines labeling the first vital staining with Alizarin and by white-dotted lines the second treatment by Calcein green. (C) Posterior frontal bone advancement (long white arrows) revealed after second vital staining with Calcein green, and lateral growth of frontal bone (small arrow on the left side). Note the interdigitation of the frontal and parietal bones. Skulls were dissected and mounted for imaging from a dorsal view. |

Histological examination of cranial sutures in adult zebrafish. H&E stained transverse sections (A-C) and sagittal sections (D-E) of skulls. (A) The interfrontal suture (boxed) and presented in (B) higher magnification; green arrows indicate the interfrontal suture between overlapping frontal bones. (C) The sagittal suture (yellow arrow) observed between two parietal bones. (D) The sagittal plane of sectioning revealed the coronal (left box) and lambdoid sutures (right box, black arrow). (E) The posterior frontal bone overlapping the anterior portion of the parietal bone, with the coronal suture formed between them (red arrow). (F) The lambdoid suture (black arrow) separates the parietal (upper plate) and the supraoccipital bone (lower plate). |

RNA detection for genetic markers of osteoblasts in juvenile animals assessed using RNAscope in situ hybridization on paraffin section. (A-F) Sequential sections (4 μm) of the interfrontal suture collected from juvenile zebrafish at age of 6 wpf. The expression of individual genes is visualized in red, counterstained with haematoxylin for nuclei in purple; black arrows examples of positive expression, all green arrows indicate negative for expression cells. (A) The expression of col1a1a is present in all cells. (B) The green arrow indicates cells that are negative for col10a1a expression in the mid-suture domain. (C) Expression of bglap weaker at the tips of frontal bones as indicated by blue arrow. (D) Expression of sp7 at osteogenic fronts (blue arrow) and along the frontal bone (red arrow), (E) runx2b at the osteogenic front (blue arrow) and along the bone (black arrow). (F) fgfr3 expression observed in osteogenic front (blue arrow) and along the frontal bones (black and purple arrows). The scale bar represents 20 μm. EXPRESSION / LABELING:
|

RNAscope in situ hybridization and IHC for GFP performed for adults at 12 wpf. (A-F) Sequential sections (4 μm) of interfrontal suture expression. Names of genes tested by RNAscope in situ hybridization are labeled on each image. (A, B) Representative images of the skull taken at low magnification (5x) that visualize entire expression pattern of (A) col1a1a and (B) col10a1a. (C-F) Images of interfrontal sutures and the expression of representative genes as labeled on each image. (G) Immunohistochemistry for sp7 observed in the interfrontal suture using a GFP reporter in the Tg(sp7:EGFP)b1212 transgenic line. Transverse paraffin section, GFP positive cells (green) and nuclei stained with DAPI (blue). EXPRESSION / LABELING:
|

Transmission electron micrographs show various osteogenic cells within the interfrontal sutures. The calvarium was isolated from adult zebrafish at 14 wpf. (A) An osteoblast in direct contact with the osteoid of the upper frontal plate, indicative of ongoing ossification. (B) A mid-suture osteoblast not attached to bone. (C) The longitudinal organization of collagen fibrils along the frontal bone. (D) The tip of the lower plate of the frontal bone, with adjacent associated osteoblast. Abbreviations: C—collagen fibrils, F—frontal bone, G—Golgi apparatus, N—nucleus, O–osteoid, RER–rough endoplasmic reticulum; arrows indicate collagen fibrils. |

Picro sirius red staining of transverse sections of the skulls. Plane polarized light microscopy for (A, B, C) juvenile fish (13.4 mm SL) and (D, E, F) young adult fish at age of 12 wpf respectively, at 40x magnification. (B, E) confocal microscopy of the same sections at 100x magnification, and (C, F) 3D rendered confocal images at 100x magnification. The longitudinal organization of collagen fibrils is indicated by a black arrow (D). The frontal bones are outlined by white dashed lines (B, E). The left frontal plate developed a split end and the right frontal bone grew in between. The red arrow indicates fibers connecting two frontal bones; the green arrow indicates fibers that grown in between the cells. Scale bars are 20 μm. |
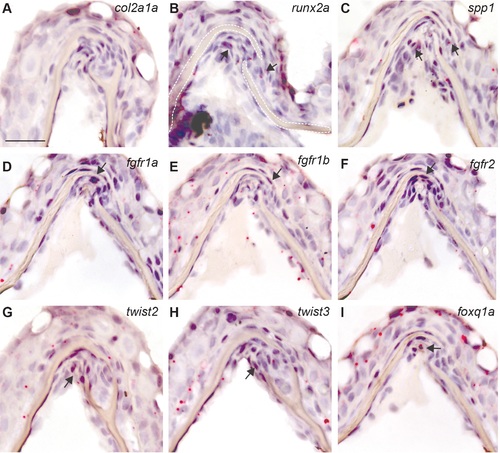
RNA detection for genetic markers of osteoblasts in juvenile animals assessed using RNAscope in situ hybridization on paraffin section. (A-I) Sequential sections (4 μm) of the interfrontal suture collected from juvenile zebrafish at age of 6 wpf. The expression of individual genes is visualized in red, counterstained with haematoxylin for nuclei in purple; black arrows indicate assumed positive expression. The expression of following genes is shown: (A) col2a1a, (B) runx2a, (C) spp1, (D) fgfr1a, (E) fgfr1b, (F) fgfr2, (G) twist2, (H) twist3, (I) foxq1a. The scale bar represents 20 μm. EXPRESSION / LABELING:
|
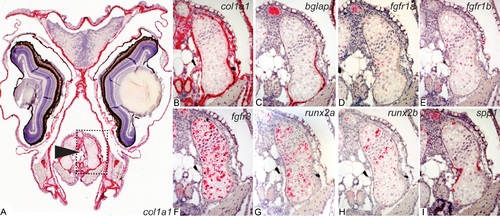
The RNA in situ detection in ceratohyal cartilage at 6 wpf evaluated by RNAscope technique. The images of the ceratohyal cartilage (dotted box and black arrowhead in A) collected from the tissue sections used for the interfrontal suture analysis shown in Fig 6 and S1 Fig. The expression of individual genes is visualized in red, counterstained with haematoxylin for nuclei in purple. The expression pattern of (A, B) col1a1a, (C) bglap, (D) fgfr1a, (E) fgfr1b, (F) fgfr3, (G) runx2a, (H) runx2b, (I) spp1. EXPRESSION / LABELING:
|
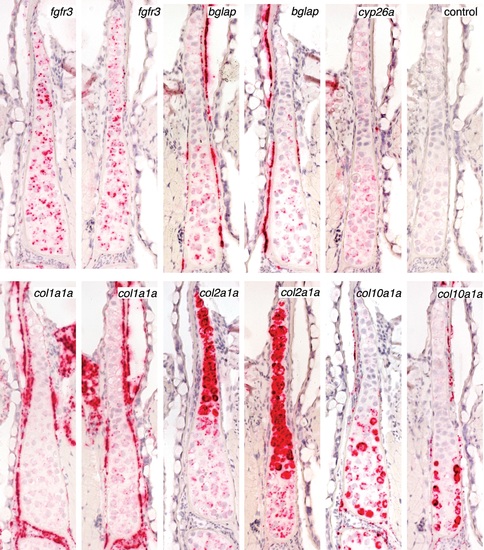
The RNA detection in the palatoquadrate cartilage at 6wpf. Both, the left and right palatoquadrate cartilages are shown as follows: fgfr3, bglap, cyp26a, col1a1a, col2a1a, col101a. The same tissue sections were analyzed for gene expression in the interfrontal suture as presented in Fig 6 and S1 and S2 Figs. EXPRESSION / LABELING:
|