
- Title
-
Loss of Mgat5a-mediated N-glycosylation stimulates regeneration in zebrafish.
- Authors
- Pei, W., Huang, S.C., Xu, L., Pettie, K., Ceci, M.L., Sánchez, M., Allende, M.L., Burgess, S.M.
- Source
- Full text @ Cell Regen (Lond)
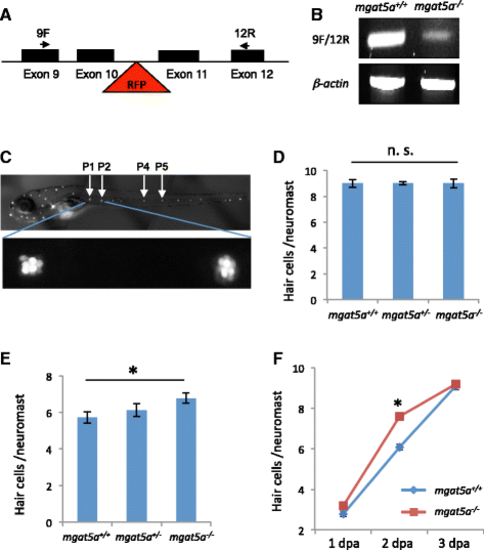
mgat5a mn0157gt mutation enhances hair cell regeneration. a Schematic diagram of the gene-trap mutation in the mgat5a gene. Exons are indicated by solid boxes. The red triangle indicates the site of the gene trap insertion. Arrows indicate the locations of primers used for mutation detection. b RT-PCR analysis of mgat5a expression in the wild-type (WT) and homozygous mutant embryos. B-actin is used as internal reference. c Fluorescent images of a wild-type embryo at 5 dpf stained with Yo-Pro-1. Upper pattern shows the distribution of neuromasts. The neuromasts used for hair cell counting are labeled. Bottom panel shows a higher magnification of P1 and P2 neuromasts. d Normal hair cell development in mgat5a mn0157gt mutants. e Enhanced hair cell regeneration in mgat5a mn0157gt mutants. f Time-course analysis for hair cell regeneration in mgat5a mn0157gt mutants. Graphs d, e, and f show the data from analyzing 24–32 embryos that were generated from a pairwise incross of heterozygotes and genotyped afterwards for genotype-phenotype correlation. Error bars show the s.e.m. The difference between wild type (WT) and homozygotes is not significant (n. s.) in d (p = 0.83), but significant in e (p = 0.02) and in f at 2 dpa (p < 0.001) PHENOTYPE:
|
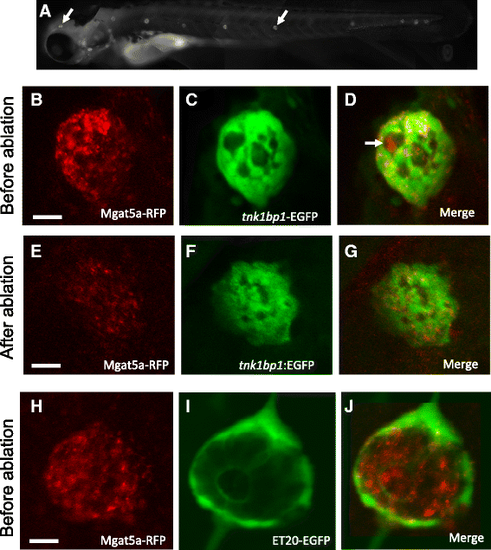
mgat5a is expressed in neuromast hair cells and supporting cells, but not in mantle cells. a RFP expression in mgat5a mn0157gt mutant. mgat5a mn0157gt homozygous embryos at 5 dpf were used for the RFP expression analysis. Arrows point to the RFP expression in the neuromasts in the head and trunk. b–g mgat5a is expressed in hair cells and supporting cells, revealed by the supporting cell labeling transgenic line Et (tnk1bp1:EGFP). When compared to the neuromasts before ablation (b–d), the neuromasts after hair cell ablation (e and g) display a dramatic reduction in RFP level. White arrows in d points to the expression of RFP in hair cells. Granulated distribution of yellow color in d indicate the co-localization of RFP and GFP in supporting cells. h–j mgat5a is not expressed in mantle cells, revealed by mantle cell labeling transgenic line Et (ET20:ET20:EGFP). RFP and GFP are localized in different areas of the neuromasts. The columns from left to right are the images from red, green, and merge channels. Scale bars 10 μm |
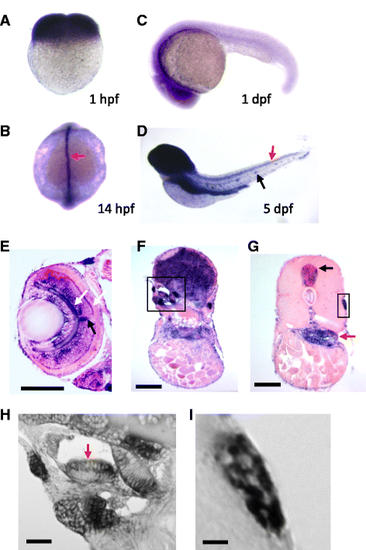
mgat5a expression during zebrafish embryo development. a–d Whole mount in situ hybridization analysis of mgat5a expression at 1 hpf (a), 14 hpf (b), 1 dpf (c), and 5 dpf (d). Orientations: lateral view in a, c, and d; dorsal view in b. Red arrow in b points to the expression in the dorsal midline. Red and black arrows in d point to the expression in spinal cord and lateral line neuromast. e–i Histology sectioning analysis of mgat5a expression in the retina (e), brain (f), and trunk (g). White arrows in e point to the expression in outer and inner plexiform layers of the retina. Black arrow in e points to the expression in the optic nerve. Black box in f demarcates the inner ear area. Black and red arrows in g point to the expression in the spinal cord and gut, respectively. Black box in g demarcates lateral line neuromast. h A magnified image of the inner ear region demarcated in f. Red arrow points to the enriched expression in the apical region of cristae. i A magnified image of the neuromast demarcated in g. Mosaic patterning indicates expression in some neuromast cells. Scale bars 100 μm in e, f, and g; 20 μm in h and i |

ZFIN is incorporating published figure images and captions as part of an ongoing project. Figures from some publications have not yet been curated, or are not available for display because of copyright restrictions. PHENOTYPE:
|
|
ZFIN is incorporating published figure images and captions as part of an ongoing project. Figures from some publications have not yet been curated, or are not available for display because of copyright restrictions. PHENOTYPE:
|
|
ZFIN is incorporating published figure images and captions as part of an ongoing project. Figures from some publications have not yet been curated, or are not available for display because of copyright restrictions. |
|
ZFIN is incorporating published figure images and captions as part of an ongoing project. Figures from some publications have not yet been curated, or are not available for display because of copyright restrictions. |
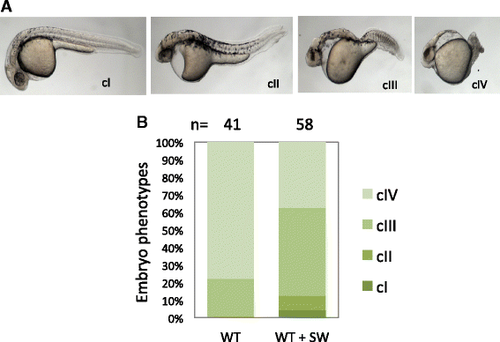
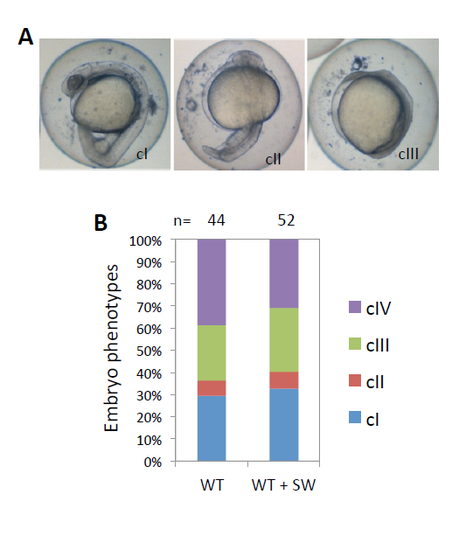
Inhibition of N-glycosylation reduces responsiveness to TGF-beta antagonist Lefty1. a Classification of morphological phenotypes at 1 dpf. WT embryos were injected with 25 pg of lefty1 mRNA at one-cell stage, treated without or with 50 μg/ml SW from 4 hpf until 24 hpf, and then used for phenotypic analysis. Representative phenotypes for each class of embryos are shown, with the embryos oriented in a lateral view. cI–cIV, class I–class IV. b Percentage of embryos with different classes of phenotypes. Number of embryos analyzed is as indicated. A significant difference is detected between the control and SW-treated groups (p < 0.001) |
Inhibition of N-glycosylation shows no effect on the responsiveness to TGF-beta agonist Squint. (A) Classification of morphological phenotypes of WT embryos injected with squint mRNA. WT embryos were injected with 10 pg of squint mRNA at 1-cell stage, treated without or with 50 μg/ml SW from 4 to 24 hpf and then analyzed for morphological phenotypes. cI–cIII, class I–class III. cIV embryos were dead from over-involution at the time of analysis. (B) Percentage of embryos with different classes of phenotypes. The number of embryos analyzed is as indicated. The difference between the control and SW treated groups is not significant (n. s., p = 0.33). |