
- Title
-
Ligament versus bone cell identity in the zebrafish hyoid skeleton is regulated by mef2ca
- Authors
- Nichols, J.T., Blanco-Sánchez, B., Brooks, E.P., Parthasarathy, R., Dowd, J., Subramanian, A., Nachtrab, G., Poss, K.D., Schilling, T.F., Kimmel, C.B.
- Source
- Full text @ Development
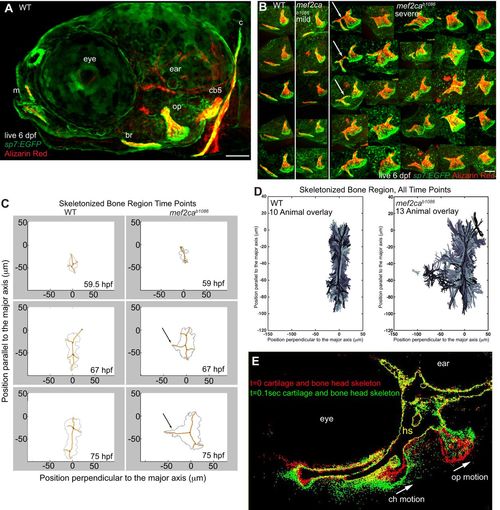
mef2cab1086 bone phenotypes and skeletal motion suggest a unique track of tissue orthogonal to the opercle. (A,B) Confocal projections of osteoblasts (sp7:EGFP) and bones (Alizarin Red) from live 6 dpf zebrafish. In A, the opercle (op) branchiostegal ray (br), cleithrum (c) and ceratobranchial 5 (cb5) bony elements are labeled and the eye, ear and mouth (m) are indicated for reference. In B, op and br bone phenotypes in wild types (WT), mef2cab1086 mutants with bone phenotypes resembling wild type (mef2cab1086 mild), and mutants with bony expansions (mef2cab1086 severe) are shown in this composite image. Arrows indicate a narrow track of extra bone. Images are projections of several confocal sections. (C) ‘Skeletonized’ time-lapse movies tracking the location and direction of ectopic growth (arrows). The major direction of op growth is along the y-axis. (D) Overlays of skeletonized time-lapse recordings from wild types and mutants. (E) Excerpts from a movie in which the head skeleton cartilage (sox9a:EGFP) and bone (sp7:EGFP) were imaged in the same fluorescent channel from a non-anesthetized larva and outlined (red). The same animal was imaged 0.1 s later and the head skeleton was outlined again (green) and overlaid on the first image revealing skeletal motion. All images are lateral views, anterior is towards the left and dorsal is upward in all panels. Scale bars: 100 µm. |
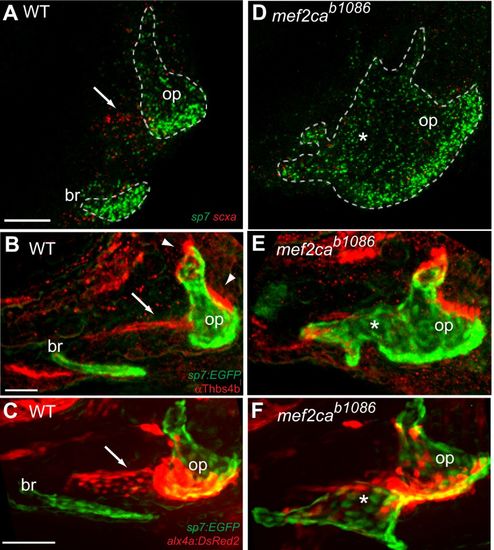
The orthogonal tissue track has ligament identity, which is lost when ectopic bone develops in mef2cab1086. (A,D) Confocal images of sp7 (green) and scxa (red) transcripts detected by in situ hybridization in 5 dpf zebrafish. (B,E) Confocal images of 5 dpf sp7:EGFP (green) transgenic larvae immunostained with anti-Thbs4b antibody (red). (C,F) Confocal images of live 6 dpf sp7:EGFP (green) and alx4a:DsRed2 (red) transgenic larvae. Wild-type (WT) and mutant (mef2cab1086) images were uniformly adjusted for brightness and contrast. The opercle (op) and branchiostegal ray (br) are indicated. Arrows mark putative ligaments, arrowheads denote tendons, asterisks mark ectopic bone where ligament identity is lost. All images are projections of several confocal sections. Lateral views, anterior is towards the left and dorsal is up. Scale bars: 50 µm. |
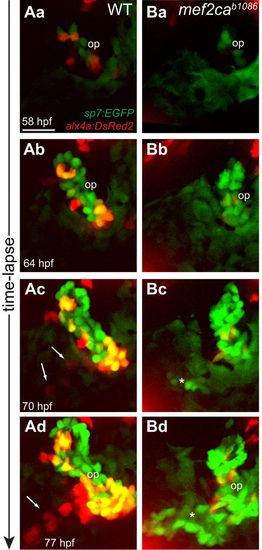
Ectopic bone cells appear in place of ligament cells in mef2cab1086. (A,B) Excerpts from a time-lapse movie imaging sp7:EGFP (green) and alx4a:DsRed2 (red) transgenic larvae. Arrows mark ligament cells, asterisks label ectopic bone cells. Background green fluorescence of the skin is visible in some images. Lateral views, anterior is towards the left and dorsal is up. op, opercle; WT, wild type. Scale bar: 10 µm. EXPRESSION / LABELING:
PHENOTYPE:
|
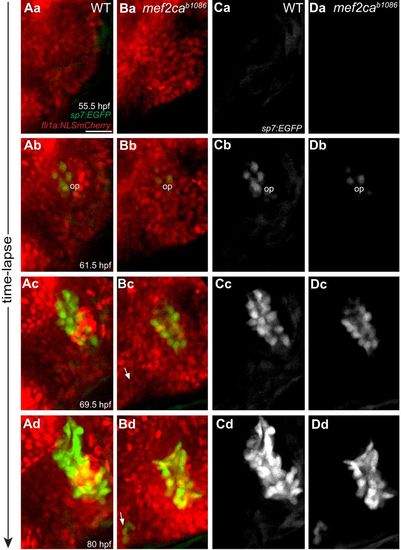
Progenitor cells remain in position and differentiate into bone in mef2cab1086. (A,B) Excerpts from a time-lapse movie imaging sp7:EGFP (green) and fli1a:NLSmCherry (red) transgenics. Arrows track a progenitor cell that ectopically initiates sp7:EGFP expression. (C,D) sp7:EGFP single channel fluorescence from images in A and B. Frames are lateral views, anterior is towards the left and dorsal is up. op, opercle; WT, wild type. Scale bar: 10 µm. EXPRESSION / LABELING:
PHENOTYPE:
|
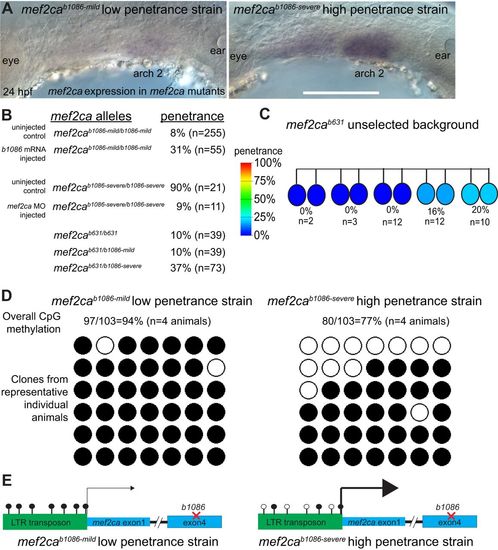
Differential mef2cab1086 transcript expression, transposon DNA methylation and functional consequences. (A) mef2cab1086 mutant transcripts were detected by in situ hybridization in the low and high penetrance strains. Images are single focal planes, lateral views, anterior is towards the left and dorsal is upward. Scale bar: 100 µm. (B) mef2cab1086 mutants from the mild (low penetrance) strain were injected with mef2cab1086 mRNA, or mef2cab1086 mutants from the severe (high penetrance) strain were injected with mef2ca morpholino (MO) and scored for penetrance of ectopic bone. mef2cab631 heterozygotes were incrossed, or crossed to mef2cab1086 heterozygotes from either the mild or severe strain and mef2ca mutant offspring were scored for penetrance of ectopic bone. (E) Full sibling mef2cab631 heterozygous adults were crossed in single-pair matings and their mef2cab631 homozygous mutant offspring were stained for cartilage and bone and scored at 6 dpf for penetrance of the ligament-to-bone fate-switch phenotype as in Fig. 5. The offspring penetrance score was assigned to the parents, which are color coded as indicated. (D) DNA methylation analysis of 6 dpf mef2cab1086 mutant larvae from the low and high penetrance strains. Bisulfite sequencing revealed the overall percentage of CpG methylation of the transposon at the mef2ca locus from four animals from each strain. Bisulfite sequencing results from a representative animal from each strain are shown in which six transposon clones from each animal, each with seven CpG sites, were sequenced. Filled circles represent methylated CpG sites. (E) Model for transposon DNA methylation and interaction with the mef2ca locus. EXPRESSION / LABELING:
|
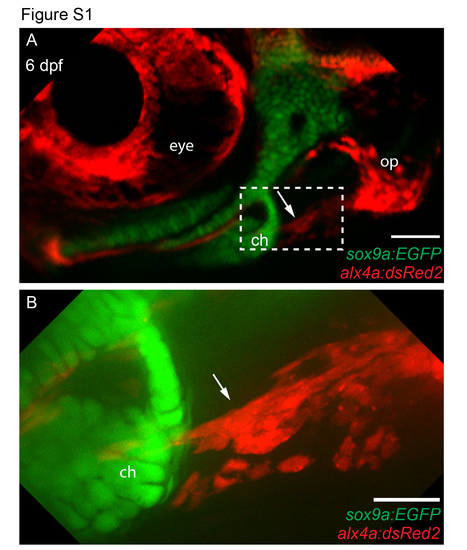
The anterior end of the operculohyoid ligament terminates at the ceratohyal cartilage. (A and B) 6 days post fertilization (dpf) sox9a:EGFP;alx4a:dsRed2 double transgenic larvae were live imaged by confocal microscopty. The dashed region in A is enlarged in B. The operculohyoid ligament is marked with an arrow, the ceratohyal (ch) cartilage, and the opercle (op) bone are indicated and the eye is shown for reference. Both images are projections of multiple confocal sections and lateral views where anterior is towards the left and dorsal is upward. Scale bars are 100µm in A, 25 µm in B. EXPRESSION / LABELING:
|
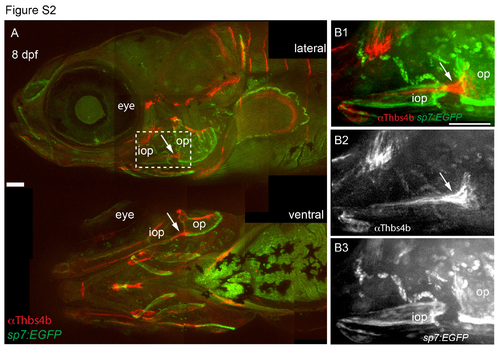
The interopercle bone develops around the operculohyoid ligament, anterior to the opercle. (A) 8 days post fertilization (dpf) sp7:EGFP wild-type larvae that began feeding at 4 dpf were fixed and stained with anti-Thbs4b and imaged by confocal microscopy. Multiple confocal projections were assembled to make a composite image. The dashed region is enlarged in B. (B) Enlargements of boxed region in A, including single channel fluorescent images of ligaments and tendons in B2 and osteoblasts in B3. The operculohyoid ligament is marked with an arrow, the opercle (op) and interopercle (iop) bony elements are indicated and teh eye is shown for reference. The late developing nature of the iop precludes analysis of this bone in mef2cab1086 mutants. All images are confocal projections and lateral views where anterior is towards the left and dorsal is upward. Scale bars are 100 µm. EXPRESSION / LABELING:
|