
- Title
-
Spemann organizer gene Goosecoid promotes delamination of neuroblasts from the otic vesicle
- Authors
- Kantarci, H., Gerberding, A., Riley, B.B.
- Source
- Full text @ Proc. Natl. Acad. Sci. USA
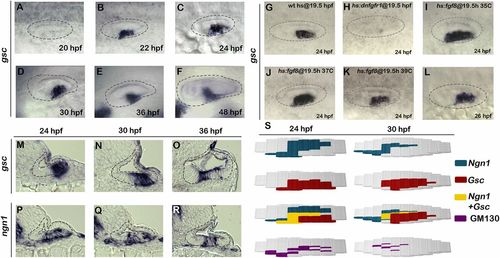
Expression and regulation of gsc during otic neurogenesis. (A–L) Whole-mount images (dorsal up, anterior left) show dorsolateral views of gsc expression in the otic vesicle (outlined) at the indicated times. (M–R) Cross-sections (dorsal up, medial left) passing through the widest part of the neurogenic domain showing expression of gsc or ngn1 at the indicated times. The otic epithelium is outlined in each image. (Magnification: F, 512×; all other images, 640×.) (S) Maps of regional markers in the floor of the otic vesicle (medial up, anterior left) generated from serial cross-sections of embryos stained for ngn1, gsc, or GM130 at 24 or 30 hpf. The location and number of cells expressing individual markers (four embryos each) was normalized and plotted accordingly. EXPRESSION / LABELING:
PHENOTYPE:
|
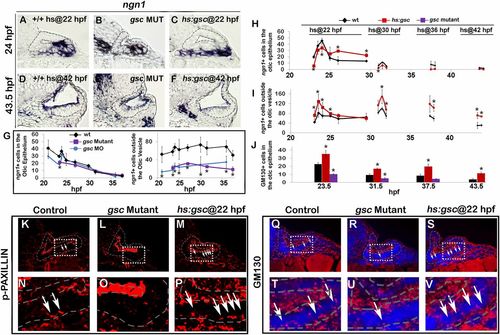
Gsc promotes EMT of otic neuroblasts. (A–F) Expression of ngn1 in cross-sections passing through the widest part of the neurogenic domain (dorsal up, medial left) just posterior to the utricular sensory epithelium expression in controls, gsc mutants, and hs:gsc embryos at 24 hpf (A–C) or 43.5 hpf (D–F). Control and transgenic embryos were heat shocked at 22 hpf (A and C) or 42 hpf (D and F). The otic epithelium is outlined in each image. (G) Mean and SD of the total number of ngn1+ cells in the otic epithelium and outside the otic vesicle for the genotypes indicated in the color key (counted from the serial sections, n = 3 or 4 otic vesicles per time point). The number of ngn1+ neuroblasts in the otic epithelium was normal in gsc mutants and morphants at all stages, except for a small but significant reduction seen in gsc morphants at 24 hpf (P < 0.05, asterisk). (H–J) For the genotypes indicated in the color key, embryos were heat shocked at the indicated times and fixed several hours later to stain for ngn1 (H and I) or basal relocalization of GM130 (J). Data show the mean and SD of the total number of stained cells in the otic epithelium or delaminated cells outside the otic vesicle (counted from the serial sections, n = 3 otic vesicles per time point). Asterisks indicate significant differences from control specimens (P < 0.05). (K–V) EMT markers in cross-sections (dorsal up, anterior left) passing through the neurogenic domain of control embryos, gsc mutants, or hs:gsc embryos immunostained for p-Paxillin (K–P) or GM130 (red) and DAPI (blue) (Q–V). Controls and transgenic embryos were heat shocked at 22 hpf. Boxed regions in K–M are magnified in N–P, and boxed regions in Q–S are magnified in T–V. White arrows indicate elevated basal staining in cells undergoing EMT. (Magnification: A, B, D, E, K–M, Q–S, 640×; C and F, 512×; N–P, T–V, 2,000×.) |
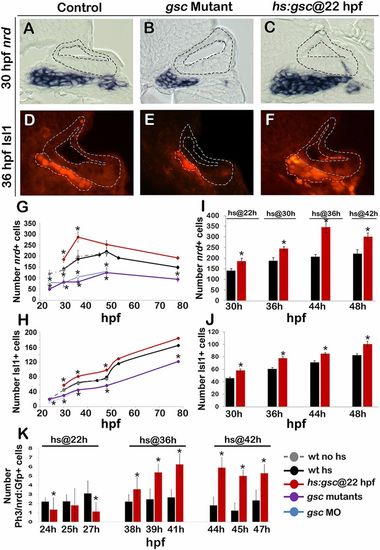
Effects of Gsc on later stages of SAG development. (A–F) Cross-sections passing through the utricular sensory epithelium (dorsal up, medial left) in controls, gsc mutants, and hs:gsc embryos showing expression of nrd (A–C) or Isl1 (outlined in orange, D–F). The otic epithelium is outlined in all images. (Magnification: A–F, 640×.) (G–J) Mean and SD of the total number of nrd+ (G and I) or Isl1+ (H and J) cells for the genotypes indicated in the color key at times presented on the x axes. nrd+ cells were counted on serial sections (n = 3–5), and Isl1+ cells were counted on whole mounts for time points between 30 and 48 hpf (n = 10–17) and on serial sections for 53 and 78 hpf (n = 2–3). (K) Means and SD of the total number of Phospho-Histone H3 (pH3)+ cells within the nrd:Gfp+ domain (which marks TA cells) at the indicated times in control and hs:gsc embryos. Embryos were heat shocked at the indicated times. Asterisks indicate statistically significant differences compared with control embryos (P < 0.05). |
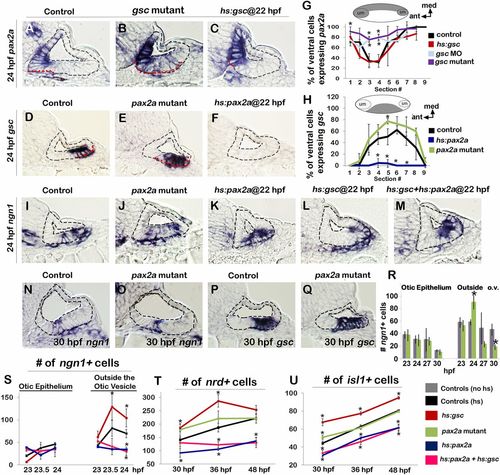
Pax2a opposes the function of Gsc in the otic epithelium. (A–F) Cross-sections (dorsal up, medial left) passing through the widest part of the neurogenic domain of the otic vesicle just posterior to the utricular macula showing expression of pax2a or gsc at 24 hpf (outlined in red) in embryos with indicated genotypes. Control and transgenic embryos were heat shocked at 22 hpf. The otic epithelium is outlined black in each image. (G and H) Means and SD of the percentage of cells expressing pax2a or gsc in successive sections through the otic floor in the embryos with indicated genotypes. Data were obtained by counting the number of stained and unstained cells in each section (n = 3–4 specimens). Illustrations of typical domains of pax2a and gsc (medial up, anterior left) are provided above each graph to help clarify spatial patterns within each section of the otic floor. (I–M) Expression of ngn1 at 24 hpf in embryos with indicated genotypes. Transgenic embryos were heat shocked at 22 hpf. (N–Q) Expression of ngn1 (N and O) and gsc (P and Q) in controls and pax2a mutants at 30 hpf. (R–U) Means and SD of the total number of ngn1+ cells inside the otic epithelium or outside the otic vesicle (R and S; counted on serial sections, n = 3–4), nrd+ TA cells (T; counted on serial sections, n = 3–4) and Isl1+ cells (U; counted on whole mounts, n = 6–12). Control (hs) and transgenic embryos were heat shocked at 22 hpf and fixed at time points indicated. Asterisks indicate significant differences compared with control embryos (P < 0.05). Hs:gsc+hs:pax2a embryos were significantly different from hs:gsc embryos at all time points but showed no statistical difference compared with hs:pax2a embryos. (Magnification: All images, 640×.) |
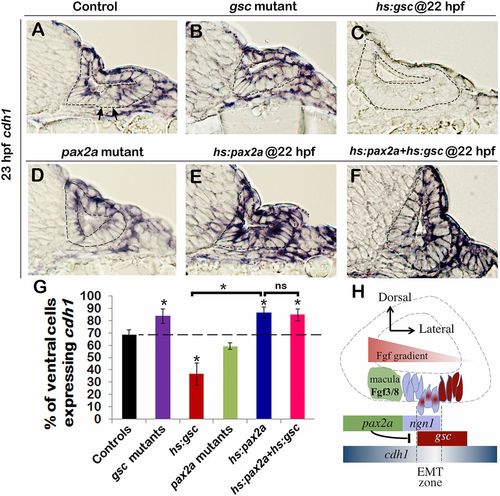
Gsc and Pax2a differentially regulate cdh1. (A–F) Cross-sections passing through the neurogenic domain of the otic vesicle just posterior to the utricular macula showing cdh1 expression at 23 hpf in embryos with indicated genotypes. The otic epithelium is outlined in each image. Arrows in A indicate cells with very low cdh1 expression interspersed with cells showing high cdh1 expression. (Magnification: A–F, 640×.) (G) Means and SD of the percentage of cells in the otic floor expressing cdh1 in the embryos with indicated genotypes. Data were obtained by counting the number of stained and unstained cells in serial sections (n = 3–4). Transgenic embryos were heat shocked at 22 hpf. Asterisks indicate significant differences between groups indicated by brackets or compared with control embryos (P < 0.05). (H) A model for regulation of epithelial tissue dynamics during otic neurogenesis. See Discussion for details. EXPRESSION / LABELING:
PHENOTYPE:
|
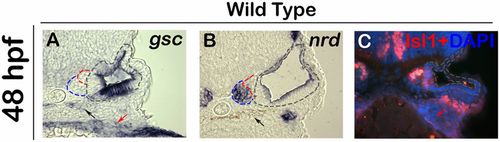
Expression of gsc during later stages of SAG development. (A–C) Images show expression of gsc (A), nrd (B), and immunodetection of Isl1 in DAPI-stained (C) cross-sections passing through the middle of the otic vesicle in wild-type embryos. The otic epithelium is outlined with black, TA cells are outlined with blue, and mature SAG neurons are outlined in red. Gsc expression is absent from the TA cells or mature SAG neurons. gsc is also expressed in the pharyngeal endoderm (red arrows) and neural crest derived pigment cells (black arrows). |
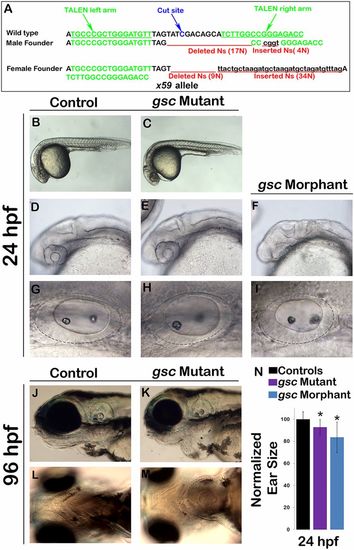
Generation of gsc mutants via TALEN targeting. (A) A summary of the TALEN target sequences on the first exon of the gsc locus (marked in green) and the resulting lesions (marked in red) at the predicted cut site (marked in blue) are shown for the two F1 founders isolated during the screening process. (B–I) Live specimens at 24 hpf were viewed at low magnification to show general morphology (B and E) and at higher magnifications to show cranial development (D–F) and the otic vesicle (G–I) in controls, gsc morphants, and gsc mutants. (J–L) Live specimens at 96 hpf viewed from lateral (J and K) or ventral (L and M) reveal cardiac edema and jaw hypoplasia in gsc mutants. (N) Means and SD of surface area of the otic vesicles, normalized to control embryos, are indicated for gsc mutants and gsc morphants at 24 hpf. Asterisks indicate statistically significant differences from the control (P < 0.05). |
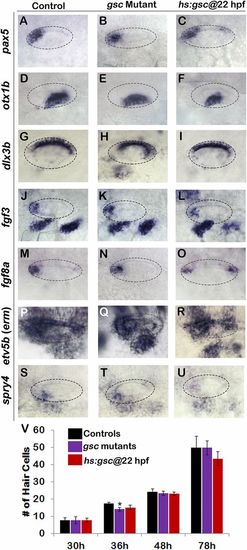
Effects of altering gsc function on otic vesicle patterning. (A–U) Whole-mount images (dorsal up, anterior left) show dorsolateral views of the otic vesicle (outlined) in controls, gsc mutants, and hs:gsc embryos for the indicated genes at 24 hpf. Patterning of the otic vesicle is not affected in gsc mutants. Hs:gsc embryos show a slight decrease in the expression of ventral-lateral otic marker otx1 (F) but otherwise appear normal. (V) Means and SD of the total number of hair cells in utricular and saccular maculae of control embryos, gsc mutants, and hs:gsc embryos at the indicated times (n = 3 embryos each). Significant differences (P < 0.05) from the control are indicated by asterisks. Data were obtained by counting hair cells in the serial sections. Accumulation of the hair cells was normal except that gsc mutants showed a small but significant decrease relative to the control at 36 hpf. There was also a slight decrease in the number of hair cells (though not statistically significant) in hs:gsc embryos at 78 hpf. |
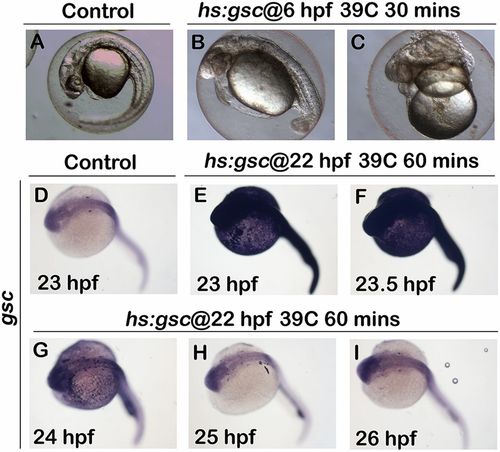
Heat-shock activation of hs:gsc during gastrulation or otic development. (A–C) Whole-mount live images at 24 hpf (dorsal up, anterior left) show the phenotypic effects of a 30-min, 39 °C heat shock initiated at 6 hpf in control and hs:gsc embryos. Activation of hs:gsc under these standard heat-shock conditions dorsalized the embryos to varying degrees (B and C). (D–I) Whole-mount images (dorsal up, anterior left) showing gsc expression in controls and hs:gsc embryos. Embryos were fixed and stained at indicated times after the end of a 60-min heat shock initiated at 22 hpf. Activation of hs:gsc at 22 hpf led to a strong increase in the gsc level by the end of the heat-shock period (E). The level of gsc expression was maximal at 23.5 hpf (F) but declined rapidly thereafter, returning to normal by 25 and 26 hpf (H and I). |
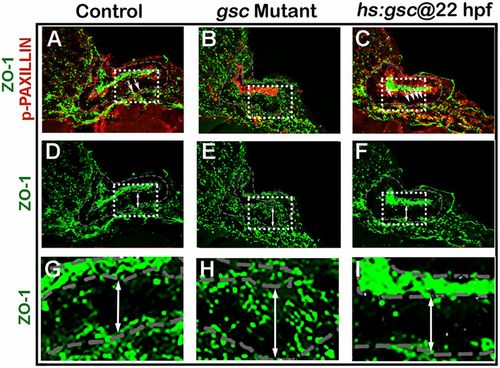
Effects of altering gsc function on ZO-1 and p-Paxillin. (A–I) Cross-sections through the neurogenic domain just posterior to the utricular macula in a control embryo (A, D, and G), gsc mutant (B, E, and H) and hs:gsc embryo (C, F, and I) at 24 hpf. These are the same sections depicted in Fig. 2 K–P but showing costaining for p-Paxillin (red) and ZO-1 (green) (A–C) or ZO-1 alone (D–I). The boxed regions in A–F are enlarged in G–I. White arrows (A–C) indicate cells undergoing EMT with elevated basal accumulation of p-Paxillin, whereas double-headed arrows (D–I) span the otic epithelium to highlight changes in ZO-1 staining. |
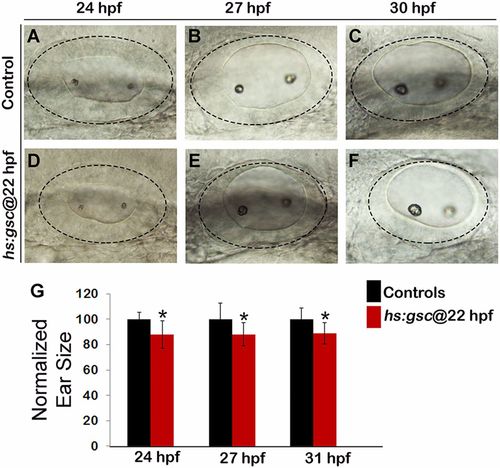
The size of the otic vesicle declines following activation of hs:gsc. (A–F) Whole-mount live specimens show dorsolateral views of the otic vesicle in controls (A–C) and hs:gsc embryos (D–F). (G) Means and SD of surface area of the otic vesicle, normalized to control embryos, are indicated for hs:gsc embryos at the indicated time points. Significant differences (P < 0.05) from the control are indicated with asterisks. |
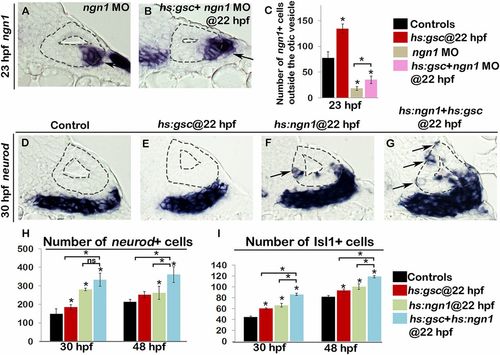
Ngn1 and Gsc work in concert during otic neurogenesis. Transgenic embryos were heat shocked at 22 hpf. (A and B) Cross-sections passing through the neurogenic domain of the otic vesicle just posterior to the utricular macula show ngn1 expression in the indicated genotypes. Black arrows indicate delaminated cells outside the otic vesicle. (C) Means and SD for the total number of ngn1+ cells outside the otic vesicle. Genotype of the embryos is indicated in the color key. (D–G) Cross-sections show nrd+ cells in embryos with indicated phenotypes. Black arrows point to the ectopic expression of nrd in the medial otic vesicle (F and G) including delamination from the medial wall of the otic vesicle in hs:gsc embryos (G). (H and I) Means and SD for the total number of nrd+ cells (H) and Isl1+ mature SAG neurons (I) in embryos with genotypes indicated in the color key. Asterisks indicate statistically significant differences between groups indicated by brackets or compared with control embryos (P < 0.05). |
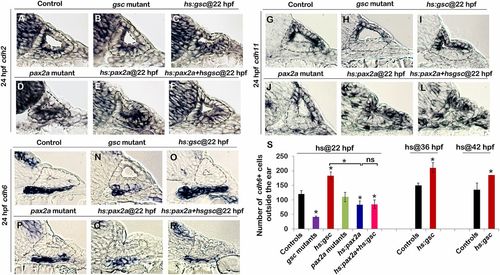
Expression of cadherin genes in relation to Pax2a or Gsc function in the otic vesicle. Transgenic embryos were heat shocked at the indicated times. (A–R) Cross-sections (dorsal up, medial left) passing through the middle of the neurogenic domain showing expression of cdh2 (A–F), cdh11 (G–L), and cdh6 (M–R) in embryos with indicated phenotypes. (S) Means and SD of the total number of cdh6-expressing cells outside the otic vesicle. Asterisks indicate significant differences between groups indicated by brackets or compared with control embryos (P < 0.05). |