
- Title
-
A Nuclear Role for miR-9 and Argonaute Proteins in Balancing Quiescent and Activated Neural Stem Cell States
- Authors
- Katz, S., Cussigh, D., Urbán, N., Blomfield, I., Guillemot, F., Bally-Cuif, L., Coolen, M.
- Source
- Full text @ Cell Rep.
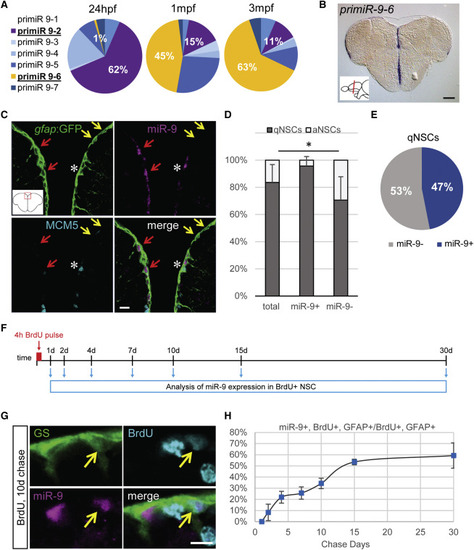
Dynamic Expression of miR-9 in qNSCs (A) qRT-PCR analysis of the seven miR-9 transcripts in 48 hr post-fertilization (hpf) embryos, 1 month post-fertilization (mpf) juvenile brains, and 3 mpf adult brains with the expression of each transcript over the sum expression of all transcripts. (B) ISH against pri-miR-9-6 on a cross-section of the telencephalon illustrating its expression restricted to the ventricular region (blue). Scale bar, 100 μm. (C) Sections through the medial region of the dorsal telencephalon showing ISH with a mature miR-9 LNA probe (magenta) and double fluorescent immunostaining for gfap:GFP (green) and MCM5 (light blue). miR-9 expression is restricted to qNSCs (gfap+, MCM5−; red arrows) and never observed in aNSCs (gfap+, MCM5+; white asterisk). Some qNSCs are devoid of miR-9 signal (yellow arrows). Scale bar, 10 μm. (D) Proportion of qNSCs (gfap+, MCM5−; dark gray) and aNSCs (gfap+, MCM5−; light gray) in the total, miR-9+ or miR-9− NSC population demonstrating that miR-9 expression is associated with quiescence. (E) Percentage of qNSCs that are miR-9+ or miR-9−. (F) Experimental design to assess miR-9 expression dynamics across the NSCs activation/quiescence cycle. (G) Representative image of BrdU+ (light blue), miR-9+ (pink), and GS+ (green) NSC 10 days after BrdU pulse. Scale bar, 5 μm. (H) Percentage of miR-9+ cells among BrdU+ NSCs after different chase period. ∗p < 0.05; one-way ANOVA with Bonferroni post hoc correction. Data are represented as mean ± 95% confidence interval (CI); n = 3 brains per condition. |
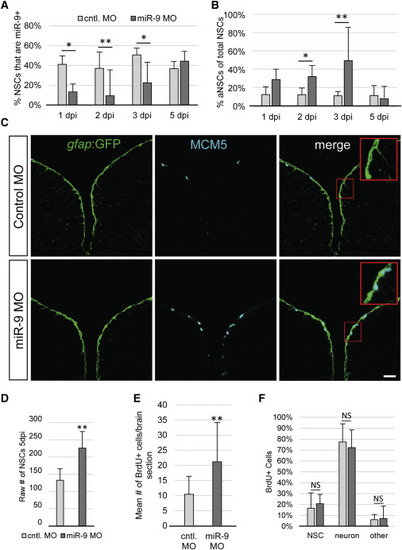
miR-9 Maintains NSC Quiescence (A) Percentage of NSCs expressing miR-9 at 1, 2, 3, and 5 days post injection (dpi) of the control vivoMO (light gray bars) or miR-9 vivoMO (dark gray bars). (B) Percentage of aNSCs (MCM5+, gfap) over the total NSCs population (gfap+) 1, 2, 3, and 5 dpi of the control vivoMO (light gray bars) or miR-9 vivoMO (dark gray bars). (C) Double immunostaining for gfap:GFP (green) and MCM5 (light blue) in control (top) and miR-9 (bottom) vivoMO-injected brains. Scale bar, 20 μm. (D) Average raw number of gfap+ NSCs per section in control (light gray bar) and miR-9 (dark gray bar) vivoMO-treated brains at 5 dpi. (E and F) Analysis of the fate of activated cells upon miR-9 kd. Fish were administered BrdU for 48 hr following injection of vivoMOs and analyzed after 30 days of chase. (E) Mean number of BrdU+ per brain section in control (light gray bar) and miR-9 (dark gray bar) vivoMO-treated brains. (F) Percentage of BrdU+ cells that remain NSCs (gfap+), or acquired a neuronal fate (HuC/D+) or other fate in control (light gray bar) and miR-9 (dark gray bar) vivoMO and brains after a 30 day chase. ∗p < 0.05, ∗∗p < 0.01; one-way ANOVA with Bonferroni post hoc correction. Data are represented as mean ± 95% CI; n = 3 brains per condition. |
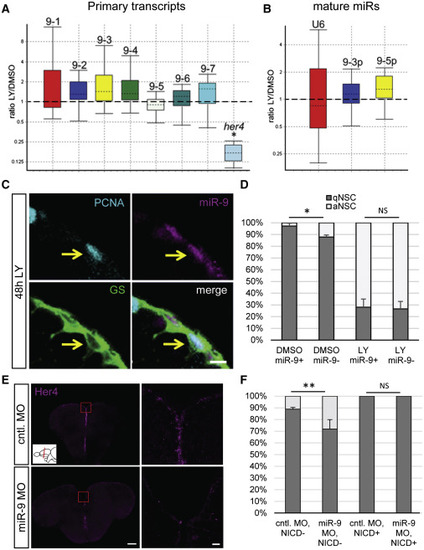
miR-9 Potentiates Notch Activity to Maintain Quiescence (A and B) Boxplots of qRT-PCR analysis showing the relative change in expression of the miR-9 transcripts and the Notch target her4 (A) and of the mature miR-9-5p/3p compared to a U6 small nucleolar RNA (snoRNA) control (B) after a 48 hr treatment with LY411575 or DMSO (control). The top and the bottom of each box indicate the 75th and 25th percentiles, respectively, and the dotted line indicates the median. (C) Expression of miR-9 (magenta) in a GS+ (green)/PCNA+ (light blue) aNSC (yellow arrow) after a 48 hr LY treatment. Scale bar, 5 μm. (D) Proportion of qNSCs (gfap+, MCM5−; dark gray) and aNSCs (gfap+, MCM5+; white) in the miR-9+ or miR-9− NSC population after a 48 hr treatment with LY or DMSO. (E) ISH for her4 2 dpi with the control (top) or miR-9 (bottom) vivoMO. Right panels are close-ups of the region within the red box. Scale bars, 100 μm (left); 50 μm (right). (F) Epistasis experiment combining miR-9 kd with overexpression of Notch intracellular domain (NICD). The graph shows the percentage of qNSCs (dark gray) and aNSCs (white) in brains injected with the control or miR-9 vivoMO and in cells overexpressing NICD (NICD+) or not (NICD−). ∗p < 0.05, ∗∗p < 0.01; one-way ANOVA with Bonferroni post hoc correction. Data are represented as mean ± 95% CI; n = 3 brains per condition. |
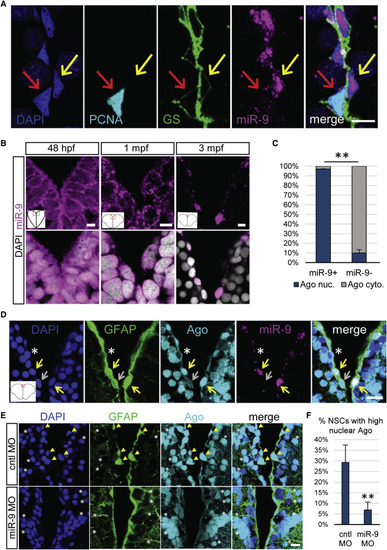
miR-9 Is Nuclear in Mature qNSCs and Is Significantly Associated with the Nuclear Localization of the RISC Effector Ago (A) Representative image of ISH for miR-9 (magenta) and double immunostaining for PCNA (light blue) and GS (green) with nuclear DAPI counterstaining (dark blue) highlighting the presence of miR-9 in the nucleus of qNSCs (yellow arrow) and not in the nucleus of aNSCs (red arrow). Scale bar, 10 μm. (B) Sections through the medial region of the dorsal telencephalic ventricle of a 48 hpf embryo, a 1 mpf juvenile, and a 3 mpf adult zebrafish illustrating an ISH of miR-9 (magenta) alone (top) and together with DAPI counterstaining in gray (bottom). Scale bar, 5 μm. (C) Proportion of cells showing strong nuclear localization of Ago (blue) or mostly cytoplasmic localization of Ago (light gray) in miR-9+ versus miR-9− NSCs populations, illustrating the association between nuclear Ago localization and miR-9 expression. (D) ISH of miR-9 (magenta) and double fluorescent immunostaining for gfap:GFP (green) and Ago (ab57113, light blue) with nuclear DAPI counterstaining (dark blue). Strong nuclear Ago localization is observed in miR-9+ NSCs (yellow arrows) in contrast to cytoplasmic Ago localization in miR-9− NSCs (white asterisk and gray arrow). Scale bar, 20 μm. (E) Double fluorescent immunostaining for gfap:GFP (green) and Ago (light blue) with nuclear DAPI counterstaining (dark blue) in conditions of miR-9 kd (bottom) when compared to controls (top). NSCs with strong nuclear Ago staining (yellow arrowheads) are lost in miR-9 MO-treated brains, while the nuclear signal for Ago in neuronal cells is not affected by miR-9 kd (white asterisks). Scale bar, 10 μm. (F) Quantification of the percentage of NSCs displaying a strong nuclear Ago signal 2 dpi of the control or miR-9 vivoMO. ∗∗p < 0.01; one-way ANOVA with Bonferroni post hoc correction. Data are represented as mean ± 95% CI; n = 3 brains per condition. |
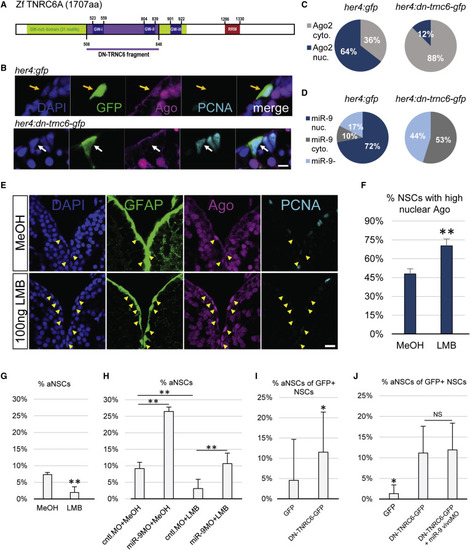
Active Nucleo-Cytoplasmic Shuttling of Ago and miR-9 Impacts the Quiescent State of NSCs (A) Scheme of the zebrafish TNRC6 protein with the cloned GW-rich Ago binding domain highlighted in purple. (B) Triple immunofluorescence of GFP (green), Ago (magenta), and PCNA (light blue) with nuclear DAPI counterstaining (dark blue) on a representative cell electroporated with a control construct (her4:gfp, top, yellow arrow) or the dominant-negative TNRC6 (DN-TNRC6) construct (her4:dn-tnrc6a-gfp, bottom, white arrow). Scale bar, 5 μm. (C) Quantification of the data from (B), showing the percentage of electroporated cells with mostly nuclear (blue) or cytoplasmic (gray) Ago signal; n = 10 brains per condition. (D) Percentage of cells electroporated with the her4:gfp (top) or her4:dn-tnrc6-gfp construct (bottom) in which miR-9 is detected in the nucleus (dark blue), cytoplasm (gray) or absent (light blue); n = 10 brains per condition. (E) Triple fluorescent immunostaining of gfap:GFP (green), Ago (magenta), and PCNA (light blue) with nuclear DAPI counterstaining (dark blue) after ventricular injection of LMB (bottom) or a MeOH control (top). Yellow arrowheads highlight NSCs with a strong nuclear Ago signal. Scale bar, 20 μm. (F and G) Quantification of data from (E) 24 hpi with LMB or MeOH as a control; n = 5 brains per condition. (F) Percentage of NSCs (gfap+) with strong nuclear Ago signal. (G) Percentage of aNSCs (PCNA+, gfap+) among NSCs (gfap+). (H) Percentage of aNSCs (PCNA+, gfap+) among NSCs (gfap+) upon combination of LMB or MeOH injections with vivoMO injections. n = 4 brains per condition. (I) Quantification of the data from (B) of the percentage of GFP+ aNSCs out of total GFP+ NSCs; n = 10 brains per condition. (J) Percentage of aNSCs (MCM2+, GFP+) out of total NSCs (GFP+) after electroporation with the control her4:gfp or her4:dn-tnrc6-gfp construct and subsequent MO injections. n = 7 brains per condition. ∗p < 0.05, ∗∗p < 0.01; one-way ANOVA with Bonferroni post hoc correction. Data are represented as mean ± 95% CI. |
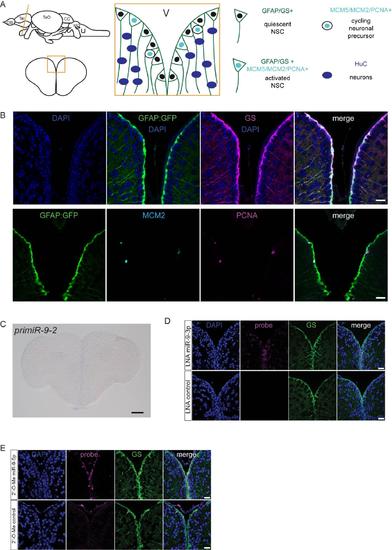
Validation of markers and of the specificity of the LNA miR-9 probe, related to figure 1. (A) Schematic representation of the germinal zone of the adult zebrafish pallium. Radial glia cells (GFAP+/GS+) lining the ventricle are bona fide NSCs and can be found in two states: activated or quiescent. The activated state is defined by the expression of proliferation markers (MCM2/MCM5/PCNA). Once activated, NSCs give rise to non-glial intermediate precursors which are committed towards neuronal differentiation. (B) Validation of the markers used in this study. All radial glia NSCs co-express GFP driven by the gfap promoter (green, gfap:GFP) and GS (magenta) (top panel). A small fraction of NSCs are found in an activated state in which they coexpress proliferation markers (MCM2, light blue; PCNA, magenta) (bottom panel). Scale bars=50μm (C) ISH of pri-miR-9-2 demonstrating that it is not expressed in the adult telencephalon. Scale Scale bar=100μm. (D) ISH using LNA probes for miR-9-3p (magenta, top panel) and a control sequence (magenta, bottom panel) with immunofluorescence for GS (green) and nuclear DAPI counterstaining (dark blue) demonstrating the specificity of the LNA probes used for mature miR-9-5p detection. In contrast to miR-9- 5p, miR-9-3p expression is much fainter and more diffuse although it is present at very low levels in the nucleus of some ventricular NSCs. (E) ISH using LNA 2'-O-Me probes for miR-9-5p (magenta, top panel) and a control sequence (magenta, bottom panel) with immunofluorescence for GS (green) and nuclear DAPI counterstaining (dark blue) confirming the exclusive expression of miR-9-5p in the ventricular NSCs. Scale bars=20μm. |
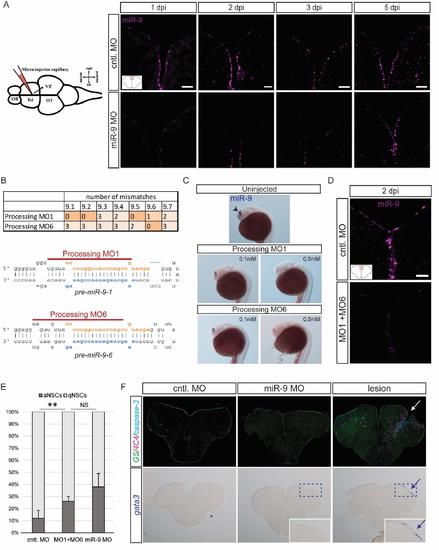
Validation of the specificity of the effect of miR-9 knock-down on NSCs, related to figure 2 (A) ISH using a miR-9 LNA probe (magenta) demonstrating efficient knock-down of miR-9 at 1, 2, 3 and 5dpi of the miR-9 vivoMO (bottom panel) when compared with the control vivoMO (bottom panel). Note that at 5dpi the vivoMO no longer has any effect. Scale bar=20μm. (B) Design of processing morpholinos. The table on the top displays the number of mismatches between the two morpholinos (MO1 and MO6) and the 7 different pre-miR-9 hairpins. The morpholinos were designed to efficiently target premiR-9 hairpins which are the most expressed in adult brains. Below, the two drawings present the target position of the two morpholinos around the Drosha processing sites on premiR-9-1 and pre-miR-9-6 hairpins. (C) ISH with miR-9 LNA probe (blue) showing effective knock-down of miR-9 by the processing morpholinos MO1 and MO6 injected in the zebrafish embryo at different doses (0.1mM and 0.5mM). At 24 hours post-fertilization (hpf), miR-9 is expressed in the embryonic telencephalon as seen in control embryos (top panel, arrowhead; Leucht et al., 2008). The processing morpholinos induce a dose-dependent decrease in mature miR-9 production (bottom panels). (D) ISH using a miR-9 LNA probe (magenta) demonstrating efficient knock-down of miR-9 at 2dpi of the processing vivoMOs into the adult brain ventricle (bottom panel) when compared with the control vivoMO (bottom panel). Scale bar=20μm. (E) Percentage of aNSCs (dark grey) and qNSCs (light grey) 2dpi of control vivoMO, processing vivoMOs or miR-9 vivoMO demonstrating significant increase in aNSCs. n=3 brains per condition; data are represented as mean ± 95% CI. (*) p<0.05, (**) p<0.01; one-way ANOVA with Bonferroni post-hoc correction (F) Immunostaining for GS (green), 4C4 anti-fish leukocytes (magenta) and cleaved caspase-3 (cyan) (top panels) and ISH with a gata3 probe (blue, bottom panels) following vivoMOs injections or a stab-wound lesion as a control of the stainings. No overt sign of acute inflammation or increased apoptosis is seen unpon vivoMO injections. |

Validation of efficient Notch blockade and effects of miR-9 knock-down on Notch target genes, related to figure 3 (A) Fluorescent immunostaining of PCNA (green) after 48h of Notch inhibition with LY (bottom panel) or the DMSO control (top panel). Scale bar= 20μm. (B) Percentage of activated NSCs (PCNA+/GFAP+) upon LY vs DMSO treatment. n=3 brains per condition; data are represented as mean ± 95% CI. (**) p<0.01; one-way ANOVA with Bonferroni post-hoc correction. (C-E) ISH using specific probes for notch3(C) and nrarpA (D, E) 2dpi with the miR-9 MO (bottom panels) or control MO (top panels). Scale bars=100μm (C, D) or 40μm (E). (F) Proposed mechanism of action of miR-9 on quiescence, through potentiating Notch activity in NSCs. |
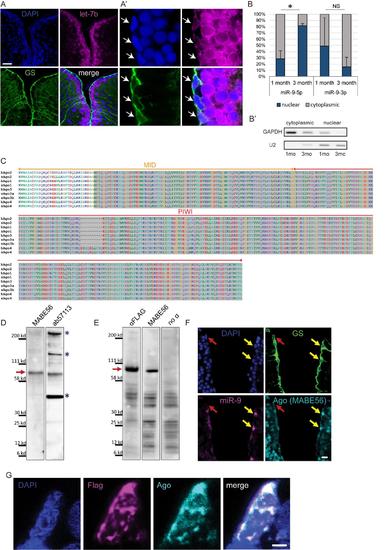
Confirmation of specific subcellular localization of miR-9 and validation of Ago antibodies (ab57113 and MABE56), related to figure 4 (A-A') ISH using LNA probe for let-7b (magenta) combined with immunostaining for GS (green) and DAPI counterstaining (dark blue). In the zebrafish pallium let-7b expression is localized to the first ventricular raws of cells (A); in NSCs (white arrows) let-7b ISH signal is restricted to the cytoplasm (A’). Scale bars=50μm (A) and 5μm (A’) (B-B’) RT-qPCR analysis of miR-9 levels in fractionated RNA samples. (B) Nucleo-cytoplasmic ratio of miR-9 and miR-9-3p levels based on qPCR analysis on fractionated samples from the juvenile (1 month-old) and adult (3 months-old) zebrafish telencephalon. n=2 biological replicates per sample; data are represented as mean ± SEM. (*) p<0.05; t-tailed t-test after arcsin transformation. (B’) Control of the purity of the cytoplasmic and nuclear fractions by PCR using GAPDH and U2 specific primers. (C) Alignment of MID and PIWI domains of Argonaute proteins from human and zebrafish. In these regions Ago proteins (1-4) sequences are highly conserved between human and zebrafish. The Ago antibody ab57113 was raised against a highly conserved portion of the C-terminal region of human Ago2 spanning the PIWI and part of the MID domains (residues 483-859; highlighted in grey). The second Ago antibody (pan-Ago MABE56) was raised against human Ago2 residues 47-859, and the epitope located to the C-terminal region. (D) Western blot analysis of adult telencephalic extracts using the two different Ago antibodies (MABE56, exposure time=5 min; ab57113, exposure time=2 min.). Red arrow indicates that both antibodies detect the Ago specific band at ~96 kd (blue asterisks indicate non-specific bands). (E) Western blot analysis of protein extracts from embryos injected with Flag-tagged zebrafish Ago2 using an anti-Flag antibody (exposure time=1 min.), Ago antibody (MABE56, exposure time=5 min.) and a no primary antibody control showing non-specific bands (exposure time=2 min.). Red arrow indicates the specific Ago band at ~96 kd detected by both the anti-Flag and anti-Ago antibodies. (F) ISH for miR-9 (magenta) and double immunofluorescence of GS (green) and Ago (MABE56, light blue) with nuclear DAPI counterstaining (dark blue). As with the ab57113 anti-Ago antibody (Figure 4D), the signal for Ago is nuclear only in the miR-9+ NSCs (yellow arrows) and not in the miR-9- NSCs (red arrow), thus validating the specific detection of Ago proteins using these antibodies. Scale bar=20μm. (G) Representative picture of a ventricular NSC electroporated with Ago2-Flag. Double immunofluorescence of Flag (magenta) and Ago (ab57113, light blue) with nuclear DAPI counterstain (dark blue) demonstrates that the expression of Ago as detected by the Ago antibody overlaps with the expression of the Flag-tagged Ago2 further validating the specificity of the Ago antibody. Notably, Ago2-Flag foci are detected in the nucleus of the electroporated cell. Scale bar=2μm. |
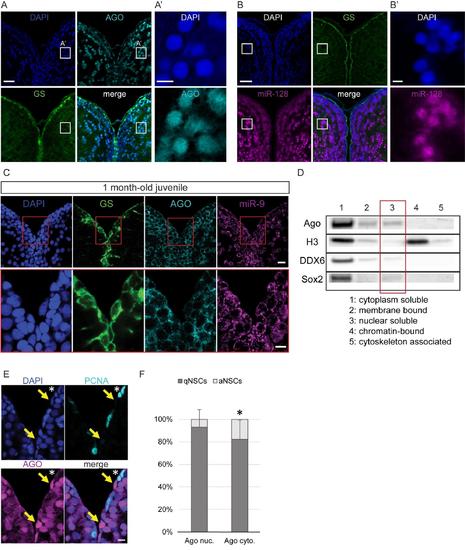
Nuclear localization of Argonaute proteins in the adult zebrafish pallium and its association with quiescence in mature NSCs, related to figure 4 (A-A’) Fluorescent immunodetection of Ago (light blue), GS (green), with DAPI counterstaining (dark blue). A’ is a zoom on the region indicated by a white square in A, showing a strong nuclear staining for AGO in some parenchymal neurons (B-B’) ISH using a LNA probe for miR-128 (magenta) combined with immunostaining for GS (green) and DAPI counterstaining (dark blue). B’ is a zoom on the region indicated by a white square in B, showing a strong nuclear staining for miR-128 in some parenchymal neurons. Scale bars=20μm (A,B) and 5μm (A’,B’) (C) Sections through the medial region of the dorsal telencephalon of a 1mpf juvenile fish showing ISH of miR-9 (magenta) and double immunofluorescence of GS (green) and Ago (light blue) with nuclear DAPI counterstaining (dark blue) demonstrating that miR-9 and Ago are located exclusively in the cytoplasm of the RG progenitors. Scale bars=10μm. (D) Western blot analysis of fractionated proteins samples from the adult zebrafish telencephalon. Substantial levels of Ago proteins can be detected in the nuclear soluble fraction (lane 3). (E) Double immunofluorescence of PCNA (light blue) and Ago (magenta) with a nuclear DAPI counterstaining (dark blue) illustrating that strong nuclear Ago is never in PCNA+ aNSCs (yellow arrows) and aNSCs express Ago in the cytoplasm (white asterisk). Scale bar=10μm. (F) Proportion of qNSCs (gfap+, MCM5-; dark grey) and aNSCs (gfap+, MCM5-; light grey) among NSCs with mostly nuclear (Ago nuc.) or cytoplasmic Ago (Ago cyto.) demonstrating an association between nuclear Ago and quiescence (χ2 p-value<0.01). n=3 brains; data are represented as mean ± 95% CI. |
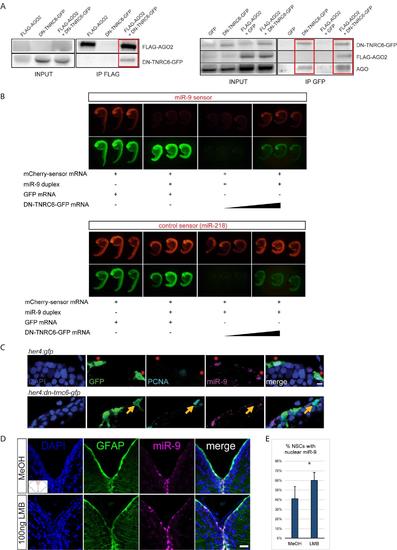
Validation of the DN-TNRC6 construct and effect of DN-TNRC6 and LMB on miR-9, related to figure 5 (A) Co-immunoprecipitation experiments between DN-TNRC6-GFP and AGO proteins. Zebrafish embryos were injected with combinations of GFP-, FLAG-AGO2- or DN-TNRC6-GFP-encoding capped mRNA and subjected to immunoprecipitation with anti- FLAG beads (left panel) or anti-GFP beads (right panels). Input samples (1/10) and co-immunoprecipitated samples were then subjected to Western blot with antibodies for GFP, FLAG or AGO. DN-TNRC6-GFP co-immunoprecipitates with FLAG-AGO2 (right panel), and both FLAG-AGO2 and endogenous AGO proteins can be co-immunoprecipitated with DN-TNRC6-GFP (left panels). (B) miR-9 sensor assays in the presence of DN-TNRC6-GFP. mCherry sensor mRNAs harbouring binding sites for miR-9 (top panel) or miR-218 (bottom panel) were injected in zebrafish eggs together with miR-9 duplexes, GFP mRNA or DN-TNRC6-GFP mRNA at increasing doses. Embryos were imaged at 24hpf and a picture of 3 representative embryos is shown for each condition. miR-9 duplexes efficiently silence miR-9 sensor expression, while having no effect on the control miR-218 sensor. High doses of DN-TNRC6-GFP mRNA induce a specific rescue of miR-9-induced silencing of the miR-9 sensor. (C) ISH for miR-9 (magenta) and double immunofluorescence of GFP (green) and PCNA (light blue) with nuclear DAPI counterstaining (dark blue) demonstrating that cells electroporated with the DNTNRC6 construct (bottom panel) never display nuclear miR-9 and enter more frequently into cell cycle as shown by expression of PCNA (yellow arrow) when compared to cells that are electroporated with the control construct (top panel) which do display miR-9 in the nucleus (red asterisks). Scale bar=5μm. (D) ISH with miR-9 LNA probe (magenta) with fluorescent immunostaining of gfap:GFP (green) and DAPI nuclear counterstaining (dark blue) after ventricular injection of LMB (bottom panel) or a MeOH control (top panel). A noticeable increase in the number of cells with high miR-9 nuclear staining is observed. Scale Bar=20μm (E) Quantifications of the experiment shown in D showing the percentage of NSCs with nuclear miR-9 staining after MeOH or LMB intraventricular injections. n=3 brains per condition; data are represented as mean ± 95% CI. (**) p<0.01; one-way ANOVA with Bonferroni post-hoc correction. |