
- Title
-
BLOS2 negatively regulates Notch signaling during neural and hematopoietic stem and progenitor cell development
- Authors
- Zhou, W., He, Q., Zhang, C., He, X., Cui, Z., Liu, F., Li, W.
- Source
- Full text @ Elife

bloc1s2 deficiency promotes HSPC production in zebrafish. (A-C) The results of (A) whole mount in situ hybridization (WISH), (B) qRT-PCR and (C) immunoblotting (Figure 5—source data 1) showed that the expression of bloc1s2 at the RNA and protein levels in bloc1s2 mutants was decreased but not abolished compared to that in control embryos at 24 hpf. Each bar represents the mean ± s.e.m of three independent experiments. **p<0.01, ***p<0.001 (Student’s t-test). (D) The Runx1 protein level was increased in bloc1s2 mutants (Figure 5—source data 2). The right panel is the quantitative analysis of the western blotting results. Each bar represents the mean ± s.e.m of three independent experiments. ***p<0.001. (E) The WISH results showed that the expression of runx1 at 24 hpf and 36 hpf, and cmyb expression at 36 hpf were increased in bloc1s2 mutants. Black arrowheads mark expression of runx1 and cmyb in the AGM region. (F) qRT-PCR results from the dissected trunk region showed that expression of cmyb at 36 hpf was significantly increased in bloc1s2 mutants. Each bar represents the mean ± s.e.m of three independent experiments. *p<0.05. (G) We generated the bloc1s2 mutants in a Tg (flk1:mcherry;cmyb:GFP) background. The upper panels show that the number of flk1+cmyb+ cells in outcrossed embryos was increased. White arrowheads mark flk1+cmyb+ cells in the AGM region at 36 hpf. The lower panel is the quantitative analysis of the western blotting results. Each bar represents the mean ± s.e.m of seven embryos. **p<0.01. (H) rag1 expression was increased in the thymus region, but gata1 and pu1 expression was decreased in the caudal hematopoietic tissue (CHT) region in bloc1s2 mutants at 4.5 dpf. Black dashed circles mark rag1 expression in the thymus region. Black arrowheads mark expression of gata1 and pu1 in the CHT region. PHENOTYPE:
|
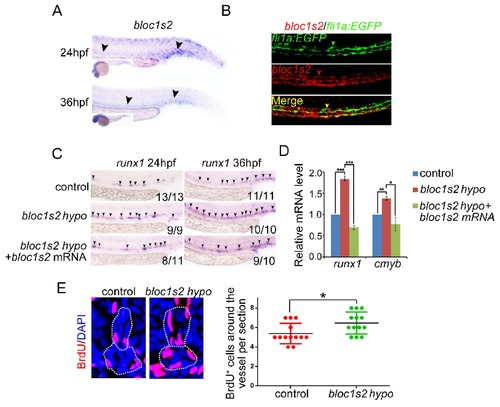
BLOS2 regulation of HSPC development in zebrafish is gene-specific. (A) WISH results showed the expression of bloc1s2 at 24 hpf and 36 hpf. Black arrowheads mark expression of bloc1s2 in the AGM region and CHT region. (B) Double fluorescence in situ hybridization showed that the expression of bloc1s2 co-localized with that of the endothelial cell marker fli1a. (C) Control and bloc1s2 mutant embryos were injected with bloc1s2 full-length mRNAs. WISH results showed that the increased expression of runx1 in bloc1s2 mutants at 36 hpf was rescued by the overexpression of bloc1s2. (D) qRT-PCR results from the dissected trunk region showed that the increased expression of runx1 and cmyb in bloc1s2 mutants at 24 hpf was rescued by the overexpression of bloc1s2. Each bar represents the mean ± s.e.m of three independent experiments. *p<0.05, **p<0.01, ***p<0.001 (Student’s t-test). (E) The left panel showed the BrdU assay in the frozen sections of control and bloc1s2 mutants at 36 hpf. The white dashed lines label the outline of the dorsal aorta and cardinal vein. The right panel is the quantification of BrdU signals around the vessels per section. Each bar represents the mean ± s.e.m of 13 embryos. *p<0.05. |
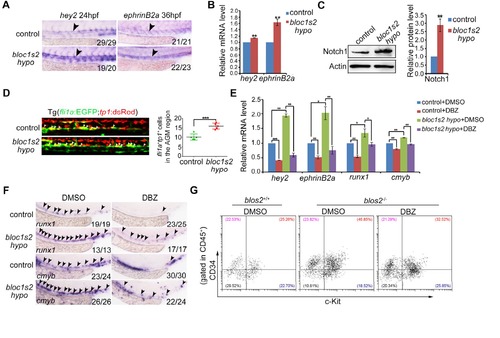
Increased Notch activity mediates the HSPC phenotype in zebrafish or mouse bloc1s2 mutants. (A) WISH results showed that the expression of Notch targets hey2 and ephrinB2a was increased in the dorsal aorta of bloc1s2 mutants. (B) qRT-PCR results from the dissected trunk region showed that expression of hey2 and ephrinB2a was significantly increased in bloc1s2 mutants. Each bar represents the mean ± s.e.m of three independent experiments. **p<0.01 (Student’s t-test). (C) Western Blot results showed that the protein level of Notch1 was increased in bloc1s2 mutants (Figure 5—figure supplement 3—source data 1). The right panel is the quantitative analysis of the western blotting results. Each bar represents the mean ± s.e.m of three independent experiments. ***p<0.001. (D) We generated bloc1s2 mutants in a Tg (fli1a:EGFP;tp1:dsRed) background. The left panels showed that the number of fli1a+tp1+ cells in bloc1s2 mutant embryos was increased. White arrowheads mark the fli1a+tp1+ cells in the AGM region at 36 hpf. The right panel is the quantification. Each bar represents the mean ± s.e.m of six embryos. **p<0.01. (E) Control and bloc1s2 mutants were treated with 4 μM DMSO or DBZ from 18 hpf to 36 hpf. qRT-PCR results from the dissected trunk region showed that the increased expression of hey2, ephrinB2a, runx1 and cmyb in bloc1s2 mutants at 36 hpf was rescued by the DBZ treatment. Each bar represents the mean ± s.e.m of three independent experiments. *p<0.05, **p<0.01, ***p<0.001. (F) WISH results showed that the increased expression of runx1 and cmyb in bloc1s2 mutants at 36 hpf was rescued by the DBZ treatment. Black arrowheads mark the expression of runx1 and cmyb in the AGM region. (G) DBZ inhibited expansion of c-Kit+CD34+ HSPCs from E11 AGM in Bloc1s2−/− mouse embryos. |

ZFIN is incorporating published figure images and captions as part of an ongoing project. Figures from some publications have not yet been curated, or are not available for display because of copyright restrictions. |