
- Title
-
Intraspinal Sensory Neurons Provide Powerful Inhibition to Motor Circuits Ensuring Postural Control during Locomotion
- Authors
- Hubbard, J.M., Böhm, U.L., Prendergast, A., Tseng, P.B., Newman, M., Stokes, C., Wyart, C.
- Source
- Full text @ Curr. Biol.
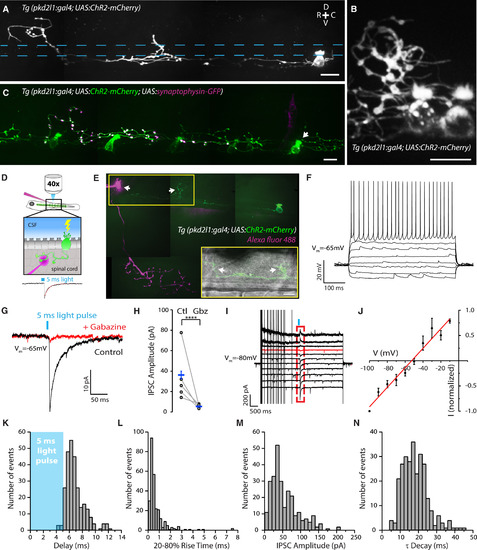
CSF-cNs Specifically Innervate the CaP Motor Neuron (A) Z projection stack showing a single ventral CSF-cN in a Tg(pkd2l1:gal4; UAS:ChR2-mCherry) double-transgenic larva at 3 days post-fertilization (dpf). Top right: dorsal (D), ventral (V), rostral (R), and caudal (C) orientation indicated by the cross. The central canal location is indicated by blue dashed lines. (B) CSF-cN axons and varicosities in the 3-dpf Tg(pkd2l1:gal4; UAS:ChR2-mCherry) transgenic larva surround a dorsal cell body. (C) Labeling of putative presynaptic boutons originating from a single CSF-cN (arrow) expressing synaptophysin-GFP in a 4-dpf Tg(pkd2l1:gal4; UAS:ChR2-mCherry) transgenic larva after injection of the construct UAS:synaptophysin-GFP. (D) Schematic of the experimental paradigm used for ChR2-mediated mapping of connectivity illustrates a CSF-cN expressing ChR2-mCherry (green) illuminated by a short pulse of light and the whole-cell patch-clamp recording of the target neuron with a pipette containing the Alexa dye to confirm the nature of the cell type (top). A 5-ms light pulse is sufficient to induce a single spike reliably in CSF-cNs (see [5]), and the subsequent IPSC is recorded in the target neuron (bottom). (E) Z projection stack showing a CaP motor neuron filled with the Alexa dye (magenta) innervated by a single CSF-cN (green) in a 4-dpf Tg(pkd2l1:gal4; UAS:ChR2-mCherry) transgenic larva with sparse expression of ChR2. The boxed region shows a wide-field image with the CaP cell body contacted by the axonal projection of the labeled CSF-cN. Arrows indicate the dorsal projections that surround the soma of the CaP motor neuron recorded and filled as well as another putative CaP motor neuron in the adjacent caudal segment. (F) Current-clamp recording of a typical CaP motor neuron showing phasic action potential firing in response to current injection (steps of 20 pA from −50 pA to +90 pA). (G) Voltage-clamp recording from a CaP motor neuron (Vm = −65 mV) showing evoked IPSCs following 5-ms light pulses before (black trace; average of ten trials) and after 10 μM gabazine treatment (red trace; average of ten trials). (H) Summary data showing that the IPSCs are abolished by gabazine. Each experiment (circle) is the average of ten trials before (Ctl) and after gabazine (Gbz) treatment (mean amplitude of control IPSC, 36.2 ± 24.9 pA; mean amplitude of gabazine IPSC, 5.4 ± 4.1 pA; n = 5, ∗∗∗∗p < 0.0001). (I and J) Voltage steps and corresponding current-voltage (I-V) curve indicate that the IPSCs (within the red dashed box) reverse at −53 mV (red trace in I) close to the reversal potential of chloride (ECl −51 mV) in our recording conditions (n = 6 cells). (K–N) Distribution of IPSC delay (K; mean 6.86 ± 0.09 ms), 20%–80% rise time (L; mean 0.89 ± 0.19 ms), current amplitude (M; mean 55.19 ± 2.34 pA, corresponding to a conductance of 3.94 nS), and time decay τ (N; mean 18.04 ± 0.42 ms) (n = 34 cells, 271 trials). Scale bars, 10 μm. See also Table S1. |
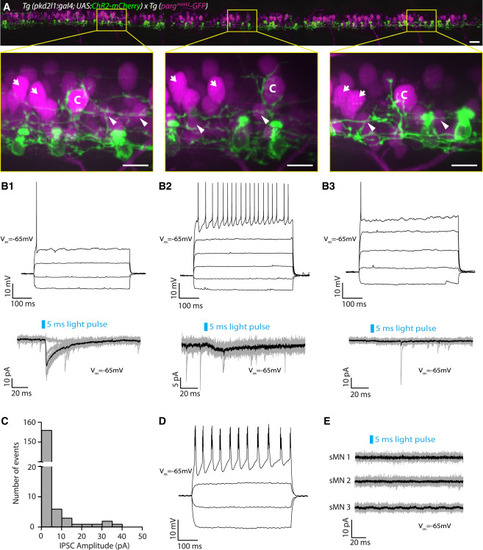
Motor Neurons Other Than CaPs Receive Limited CSF-cN Input (A) Motor neurons and CSF-cNs labeled in the Tg(pargmnet2-GFP; pkd2l1:gal4; UAS:ChR2-mCherry) transgenic line throughout the rostro-caudal axis (12 axial segments) at 3 dpf. Boxes with magnified images highlight extensive innervation of large dorsal CaP motor neurons (labeled “C”). However, other (non-CaP) primary motor neurons (indicated by arrows) and secondary motor neurons (indicated by arrowheads) do not exhibit the same extensive perisomatic innervation. Scale bars, 20 μm (top) and 10 μm (magnified boxes, bottom). (B1–B3) Examples of whole-cell recordings from non-CaP primary motor neurons showing three types of postsynaptic responses observed. (B1) Top: current-clamp recording of a primary motor neuron showing a single action potential in response to current injection (steps of 40 pA from −50 pA to +70 pA). Bottom: voltage-clamp recording from the same primary motor neuron (Vm = −65 mV) showing evoked IPSCs following 5-ms light pulses (black trace is the average of ten trials shown in gray). (B2) Top: current-clamp recording of a primary motor neuron showing tonic action potentials in response to current injection (steps of 40 pA from −50 pA to +150 pA). Bottom: voltage-clamp recording from the same primary motor neuron (Vm = −65 mV) showing small evoked IPSCs following 5-ms light pulses (black trace is the average of ten trials shown in gray). (B3) Top: current-clamp recording of a primary motor neuron showing a single action potential in response to current injection (steps of 40 pA from −30 pA to +130 pA). Bottom: voltage-clamp recording from the same primary motor neuron (Vm = −65 mV) showing no IPSCs following 5-ms light pulses (black trace is the average of ten trials shown in gray). (C) Histogram of IPSC current amplitudes from non-CaP primary motor neurons (mean 1.78 ± 0.42 pA; n = 17 cells, 170 trials). (D) Current-clamp recording of a secondary motor neuron showing bursts of action potentials in response to current injection (steps of 20 pA from −30 pA to +30 pA). (E) Example of voltage-clamp recordings from secondary motor neurons (sMNs) (Vm = −65 mV) showing no IPSCs following 5-ms light pulses (black trace is the average of ten trials shown in gray). IPSCs in secondary motor neurons were never observed following CSF-cN stimulation (n = 10). See also Table S1. |
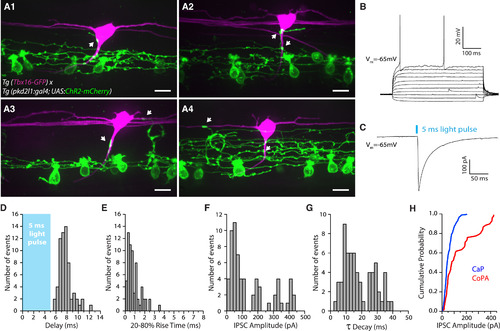
CSF-cNs Innervate CoPA Glutamatergic Sensory Interneurons (A1–A4) Z projection stack showing CoPA sensory interneurons expressing GFP (magenta) innervated by CSF-cNs (green) in Tg(pkd2l1:gal4; UAS:ChR2-mCherry; tbx16:GFP) transgenic larvae. Note the varicosities (arrows) from CSF-cNs onto CoPA soma (A1 and A2), initial segment (A2 and A3), and sometimes dendrites (A3 and A4). Scale bars, 10 μm. (B) Current-clamp recording of a typical CoPA interneuron showing sparse action potential firing in response to current injections (steps are 20 pA from −50 pA to +150 pA). (C) Voltage-clamp recording from a CoPA interneuron (Vm = −65 mV) showing an evoked IPSC following a 5-ms light pulse (black trace; average of ten trials). (D–G) Distribution of IPSC delay (D; mean 7.73 ± 0.15 ms), 20%–80% rise time (E; mean 0.88 ± 0.08 ms), amplitude (F; mean 146.83 ± 16.75 pA, corresponding to a conductance of 10.49 nS), and time decay τ (G; mean 18.16 ± 1.22 ms) (n = 8 cells, 64 trials). (H) Cumulative probability plot of IPSC amplitudes for CaP motor neurons (blue; n = 271) and CoPA interneurons (red; n = 64). See also Table S1. |
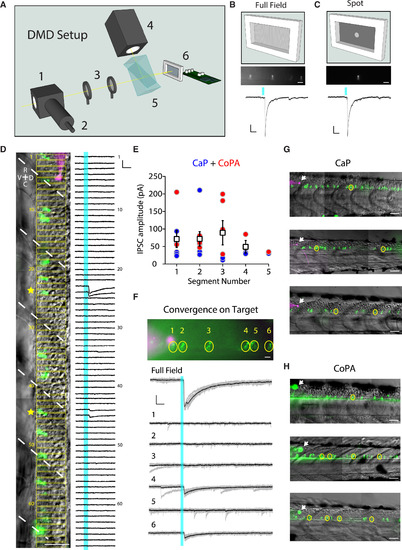
2D Light Patterning at Single-Cell Resolution Reveals Convergence of Inputs from CSF-cNs onto Their Targets (A) Schematic of the digital mirror device (DMD) setup showing the light path. A beamsplitter (1) was attached to the epi-port of an upright microscope in order to combine light from the epifluorescence light source via an optical fiber (2) and the light from the DMD. The patterned light from the DMD was relayed into the epifluorescence light path via a telescope (3). A white light-emitting diode (LED) (4) providing the light for patterned illumination was directed via a total internal reflection prism (5) to the DMD (6). (B and C) Physiological responses to either full-field illumination (B) or a small spot on an individual CSF-cN (C). Top: fluorescent image of multiple CSF-cNs from the Tg(pkd2l1:gal4; UAS:ChR2-mCherry) transgenic line with all (B) or a subset of the central mirrors activated (C). Scale bars, 20 μm. Bottom: IPSCs following a 5-ms light pulse from either full-field (B) or patterned illumination (C). In cases where only one CSF-cN is connected to the target, the IPSC amplitude evoked by the spot recapitulates the IPSC amplitude evoked by the full-field illumination. Scale bars, 50 ms horizontal and 20 pA vertical. (D) Example experiment investigating the connectivity from CSF-cNs (green) to a CaP motor neuron (magenta) showing multiple CSF-cNs projecting onto the postsynaptic target. Light was patterned in rectangles (indicated in yellow), which were sequentially illuminated along the rostro-caudal axis during voltage-clamp recording of the target neuron. Right: voltage-clamp traces resulting from the light activation of the corresponding rectangular region. IPSCs are observed when the light is patterned onto a subset of CSF-cNs (yellow stars). White dashed lines indicate segment boundaries. Scale bars, 50 μm (image) and 10 ms horizontal and 50 pA vertical (electrophysiological traces). (E) Quantification of the IPSC amplitude for CaP (blue circles) and CoPA (red circles) as a function of the number of segments between a CSF-cN and its target. Mean IPSC amplitude for CaP and CoPA combined is plotted for each segment (white boxes). (F) Convergence of CSF-cNs onto a CaP motor neuron. Image of CSF-cNs expressing ChR2-mCherry (green) and the target CaP motor neuron filled with Alexa dye (magenta). IPSCs in response to either full-field or patterned illumination show that cells “4” and “6” converge onto the CaP motor neuron target. (G and H) Examples of identified connections from CSF-cNs to CaP motor neurons (G) and CoPA neurons (H) in three different larvae. Arrows indicate the patched target cell body. Yellow circles show connected CSF-cNs. Scale bars, 50 μm. See also Table S1. |
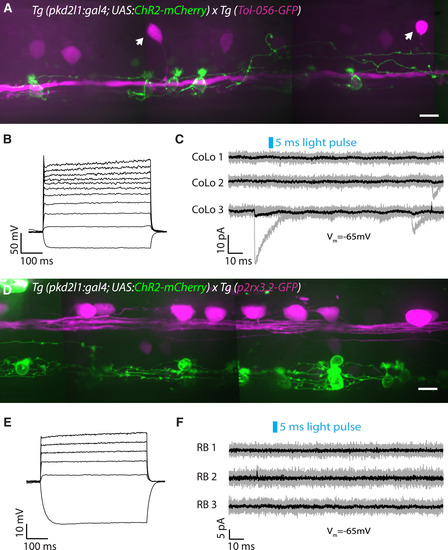
CSF-cN Local Innervation onto the Escape Circuit Is Restricted to Excitatory Interneurons and Motor Neurons (A) Z projection stack of CoLo glycinergic premotor interneurons expressing GFP (magenta) and CSF-cNs (green) in a Tg(pkd2l1:gal4; UAS:ChR2-mCherry; Tol-056-GFP) transgenic larva at 3 dpf. Arrows indicate CoLo cell bodies. Scale bar, 10 μm. (B) Current-clamp recording showing the typical firing pattern of a CoLo neuron with a single weak action potential in response to current injection (steps of 20 pA from −30 pA to +370 pA). (C) CSF-cN stimulation elicited by a 5-ms light pulse fails to induce an IPSC in CoLos. Example of voltage-clamp recordings from three CoLos (Vm = −65 mV) showing no IPSCs following 5-ms light pulses (black trace is the average of ten trials shown in gray). IPSCs in CoLos were never observed following CSF-cN stimulation (n = 13 cells). (D) Z projection stack showing Rohon-Beard neurons expressing GFP (magenta) and CSF-cNs (green) in a Tg(pkd2l1:gal4; UAS:ChR2-mCherry; p2rx3.2:GFP) transgenic larva at 3 dpf. Note that the axonal projections of CSF-cNs do not reach Rohon-Beard somas or axons. Scale bar, 10 μm. (E) Current-clamp recording showing the typical firing pattern of a Rohon-Beard neuron with a single weak action potential in response to current injection (steps of 20 pA from −30 pA to +170 pA). (F) CSF-cN stimulation elicited by a 5-ms light pulse fails to induce an IPSC in Rohon-Beard (RB) neurons. Example of voltage-clamp recordings from three Rohon-Beard neurons (Vm = −65 mV) showing no IPSCs following 5-ms light pulses (black trace is the average of ten trials shown in gray). IPSCs in Rohon-Beard neurons were never observed following CSF-cN stimulation (n = 10 cells). See also Table S1. |
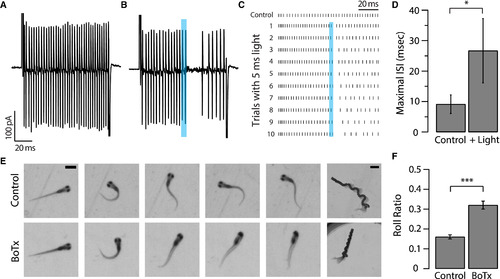
Silencing CSF-cNs Induces a Defect in Balance during Fast Swimming (A) A voltage step (+180 mV for 100 ms from a holding potential of −65 mV) in cell-attached mode leads to high-frequency CaP motor neuron spiking in the control condition. (B) Typical trial showing that in a Tg(pkd2l1:gal4; UAS:ChR2-mCherry) transgenic larva a 5-ms light pulse applied during the voltage step leads to the prompt silencing of the CaP motor neuron for approximately 20 ms. (C) Raster plot of CaP spiking without (top trace) and with (bottom ten traces) optogenetic stimulation of CSF-cNs. Repetition of ten sequential trials confirmed the robust effect of silencing CaP firing. The duration of silencing tended to increase during sequential trials. (D) Maximum interspike interval (ISI) was quantified for five spikes prior to the light pulse and five spikes following the light pulse. All cells showed silencing following the 5-ms light pulse, illustrated by an increase in ISI (9.10 ms ± 3.04 ms before and 26.69 ms ± 10.55 ms after the light pulse; n = 4, paired t test: ∗p = 0.02). (E) Sample sequence of images acquired with a high-speed camera during acoustically evoked escaped responses for Tg(pkd2l1:gal4; UAS:BoTxBLC-GFP) transgenic larvae and control siblings. Magnified images (five panels on the left) demonstrate the rolling phenotype when CSF-cNs are genetically targeted with BotxBLC-GFP+ to silence GABA release (scale bars, 1 mm). Z stack of the entire escape response sequence for BotxBLC-GFP+ and control siblings (panels on the right; scale bars, 2 mm). (F) Calculated roll ratio for Tg(pkd2l1:gal4; UAS:BoTxBLC-GFP) transgenic larvae and control siblings (n = 148 fish for each genotype). BotxBLC-GFP+ fish were significantly more likely to tip over and roll during the escape response than the control siblings (∗∗∗p < 0.001). See also Figure S1, Table S1, and Movies S1, S2, and S3. |