
- Title
-
Genetic inhibition of autophagy promotes p53 loss-of-heterozygosity and tumorigenesis
- Authors
- Lee, E., Wei, Y., Zou, Z., Tucker, K., Rakheja, D., Levine, B., Amatruda, J.F.
- Source
- Full text @ Oncotarget

ZFIN is incorporating published figure images and captions as part of an ongoing project. Figures from some publications have not yet been curated, or are not available for display because of copyright restrictions. |
|
ZFIN is incorporating published figure images and captions as part of an ongoing project. Figures from some publications have not yet been curated, or are not available for display because of copyright restrictions. PHENOTYPE:
|
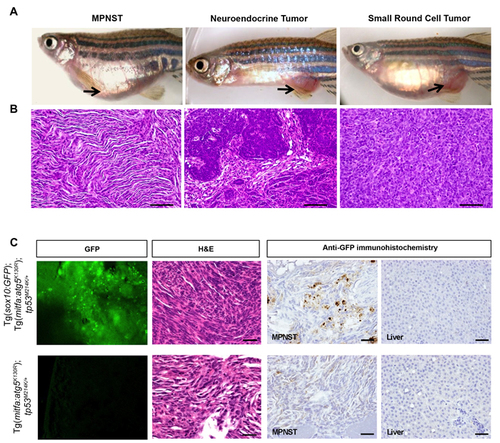
MPNSTs arising in Tg(mitfa:atg5K130R); tp53M214K/+ fish express sox10. A.-B. Representative photomicrographs of gross macroscopic appearance of tumors A. and hematoxylin and eosin (H&E) stained microscopic sections of corresponding tumors B. in Tg(mitfa:atg5K130R); tp53M214K/+ fish. MPNST, malignant peripheral nerve sheath tumor. Scale bars, 50 μm. See Table 1 for details of numbers of fish with each tumor type. C. Representative confocal images to detect GFP expression, H&E staining, and anti-GFP immunoperoxidase staining of an MPNST from a Tg(mitfa:atg5K130R); Tg(sox10:EGFP); tp53M214K/+ fish (top) and an MPNST from a GFP-negative control Tg(mitfa:atg5K130R); tp53M214K/+ (bottom). Liver is shown for the anti-GFP immunoperoxidase staining as a representative non-tumor tissue (right panels). Scale bars, 100 µm. |
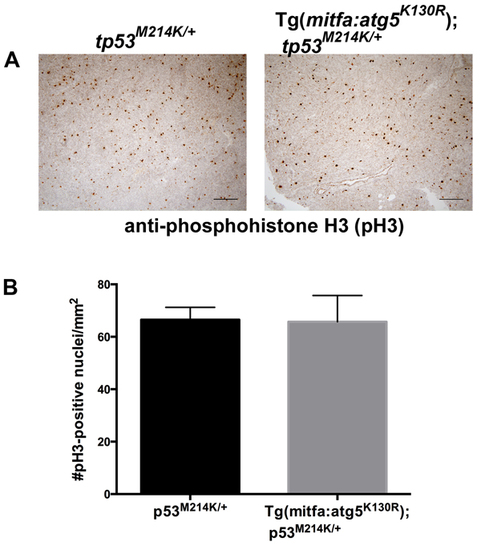
Cell proliferation rates are equivalent in MPNSTs from atg5K130R transgenic and non-transgenic p53-deficient fish. A. Anti-phosphohistone H3 immunohistochemistry of tp53M214K/+ and Tg(mitfa:atg5K130R); tp53M214K/+ fish. B. Quantification of staining. Mean +/- SEM of 5 tumors per genotype is shown. |
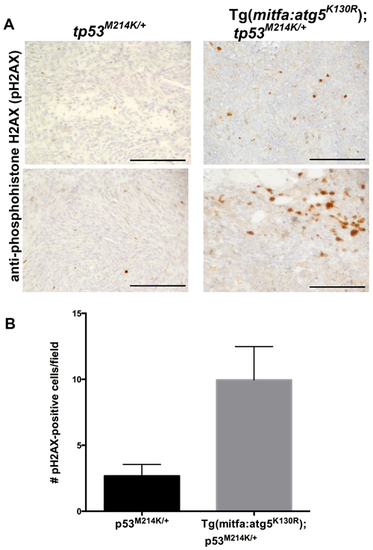
MPSNTs arising in atg5K130R transgenics have increased double-stranded DNA breaks.A. Anti-phosphohistone H2AX immunohistochemistry of tp53M214K/+ and Tg(mitfa:atg5K130R); tp53M214K/+ fish. Scale bar: 100 µm. B. Quantification of staining. Mean +/- SEM of 40 fields from each of 5 tumors per genotype is shown. |