
- Title
-
Transforming Growth Factor β Drives Hemogenic Endothelium Programming and the Transition to Hematopoietic Stem Cells
- Authors
- Monteiro, R., Pinheiro, P., Joseph, N., Peterkin, T., Koth, J., Repapi, E., Bonkhofer, F., Kirmizitas, A., Patient, R.
- Source
- Full text @ Dev. Cell
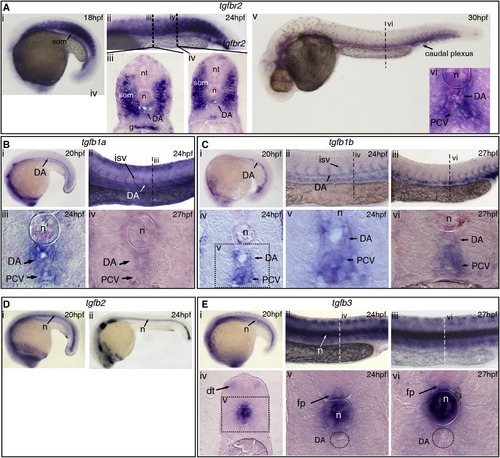
TGFβ Signaling Components Are Expressed in and around the Embryonic Dorsal Aorta (A) Expression of tgfbR2 at (i) 18 hpf and (ii–iv) 24 hpf, including the somites, dorsal aorta (DA), and gut. (v–vi) At 30 hpf, expression was confined to the DA, notochord, posterior cardinal vein (PCV), and some of the surrounding mesenchyme. (B) Expression of tgfb1a in the DA at (i) 20 hpf and (ii, iii) in the DA, PCV, and intersomitic vessels (ISVs) at 24 hpf. At 27 hpf, there was very little expression of tgfb1a remaining in the DA. (C) tgfb1b is also expressed in the DA (i) at 20 hpf and in the DA and PCV at (ii) 24 hpf and (iii) 27 hpf. (iv, v) Transversal sections show tgfb1b expression at 24 hpf in the DA and PCV. (vi) Tgfb1b was still apparent in the DA and PCV by 27 hpf. (D) Expression of tgfb2 at (i) 20 hpf and (ii) 24 hpf. Notochord-specific expression was found throughout all the stages analyzed. (E) Expression of tgfb3 at (i) 20 hpf, (ii) 24 hpf, and (iii) 27 hpf. (iv, v) Transversal section at 24 hpf, showing expression in the dorsal tip of the somites, notochord, and floorplate. (vi) Expression in the notochord and floorplate was maintained at 27 hpf. Note that tgfb3 is absent from the DA. g, gut; dt, dorsal tip of the somite; fp, floorplate; isv, intersomitic vessel; n, notochord; nt, neural tube; som, somite. See also Figure S1. EXPRESSION / LABELING:
|
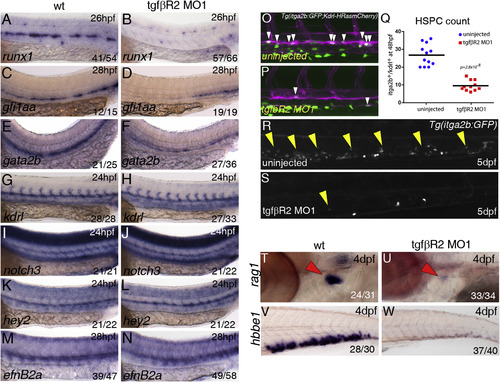
TGFβ Signaling Is Required for Specification of HSCs Expression of runx1 in (A) wild-type (wt) and (B) tgfbr2 morphants at 26 hpf. Expression of gfi1aa in (C) wild-type or (D) tgfbr2 morphants at 26 hpf. Expression of gata2b in (E) wild-type or (F) tgfbr2 morphants at 26 hpf. Expression of the vascular marker kdrl (G, H) and the arterial markers notch3 (I, J), hey2 (K, L), and efnB2A (M, N) is unaffected in tgfbR2 morphants. Maximum projections of itga2b:GFP; Kdrl:HRas-mCherry transgenic embryos at 48 hpf in (O) uninjected and (P) tgfbr2 MO1-injected embryos. Region shown includes part of the DA and white arrowheads denote itga2b:GFP+(green), kdrl:HRas-mCherry+ (magenta) HSPCs. (Q) HSPC counts in the entire trunk region of uninjected and tgfbR2 morphant itga2b:GFP; Kdrl:HRas-mCherry transgenic embryos at 48 hpf (p value is indicated on the graph, n = 12 (wild-type) and n = 11 (tgfbR2MO1). itga2b-GFP+ cells are present in the CHT of itga2b:GFP embryos (R, yellow arrowheads) and greatly reduced in the CHT of tgfbR2 morphants at 5 dpf (S). Expression of rag1 in the thymus (red arrowheads) at 4 dpf in (T) wild-type and (U) tgfbR2 morphants. Expression of hbbe1 in the CHT at 4 dpf in (V) wild-type and (W) tgfbR2 morphants. The numbers of embryos are shown in each panel as the number of embryos with phenotype/total number analyzed. See also Figure S2. |
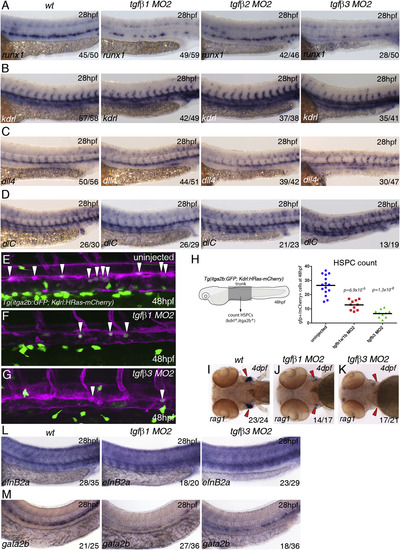
TGFβ1 and TGFβ3 Are Required for Specification of HSCs (A) Expression of runx1 in wild-type, tgfb1, tgfb2, and tgfb3 morphants. (B) Expression of kdrl in wild-type, tgfb1, tgfb2, and tgfb3 morphants. (C) Expression of dll4 in wild-type, tgfb1, tgfb2, and tgfb3 morphants. (D) Expression of dlC in wild-type, tgfb1, tgfb2, and tgfb3 morphants. All samples were analyzed at 28 hpf. (E-G) Maximum projections of itga2b:GFP; Kdrl:HRas-mCherry transgenic embryos in (E) uninjected, (F) tgfb1 morphants, and (G) tgfb3 morphants at 48 hpf. The images show part of the trunk DA and white arrowheads denote itga2b:GFP+ (green), kdrl:HRas-mCherry+ (magenta) HSPCs. (H) HSPCs counts in the entire trunk region of uninjected, tgfb1, and tgfb3 morphant itga2b:GFP; Kdrl:HRas-mCherry transgenic embryos at 48 hpf (p value is indicated on the graph, n = 10 for each of the conditions). (I-K) Expression of rag1 in the thymus at 4 dpf (red arrowheads) in (I) wild-type, (J) tgfb1 morphants, and (K) tgfb3 morphants. (L) Expression of efnB2a in wild-type, tgfb1, and tgfb3 morphants. (M) Expression of gata2b in wild-type, tgfb1, and tgfb3 morphants. The numbers of embryos are shown in each panel as the number of embryos with phenotype/total number analyzed. See also Figure S3. |
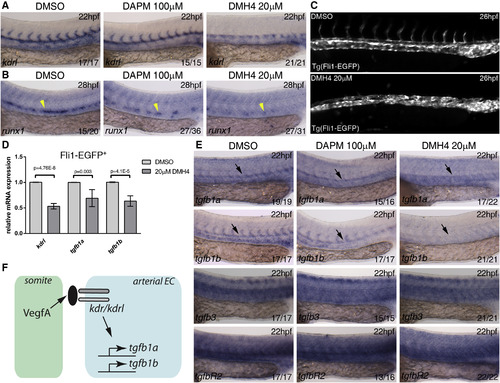
Vegf Signaling Is Required for tgfb1a and tgfb1b Expression in the Dorsal Aorta (A and B) Wild-type embryos were treated from 10 hpf with DMSO (control), Vegf inhibitor DMH4 (20 µM), and Notch inhibitor DAPM (100 µM) and collected at 22 hpf or 28 hpf. Embryos were collected and analyzed for (A) kdrl expression at 22 hpf and (B) runx1 expression at 28 hpf. (C) Tg(Fli1:EGFP) embryos were treated from 10 to 26 hpf with DMSO or DMH4 (20 µM). DMH4-treated embryos showed a severe loss of intersomitic vessels but ECs are still present in the trunk, and circulation was detected in a majority of embryos at 48 hpf (data not shown). (D) Expression of kdrl, tgfb1a, tgfb1b by qPCR in 26 hpf sorted Fli1:EGFP+ ECs. All three genes were downregulated after DMH4 treatment. Results are shown as averages ± SD of 4-5 biological replicates. (E) Wild-type embryos were treated from 10 hpf with DMSO (control), Vegf inhibitor DMH4 (20 µM), and Notch inhibitor DAPM (100 µM) and collected at 22 hpf for analysis of tgfb1a, tgfb1b, tgfb3, and tgfbR2 by in situ hybridization at 22 hpf. (F) Schematic representation of the experimental results. Black arrows indicate the location of the DA; yellow arrowheads indicate the location of runx1 expression in the floor of the DA. The numbers of embryos are shown in each panel as the number of embryos with phenotype/total number analyzed. Arterial EC, arterial endothelial cell. See also Figure S4. EXPRESSION / LABELING:
PHENOTYPE:
|
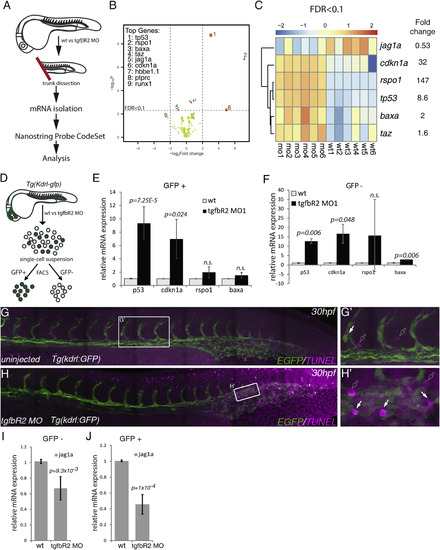
Multiplex Analysis of Gene Expression Shows that jag1a Is a Downstream Target of TGFβ Signaling (A) Schematic representation of the trunk dissection experiment for isolation of mRNA for hybridization with the NanoString Probe CodeSet. Six groups of independent wild-type (wt1-6) and tgfbR2MO1-injected embryos (mo1-6) were used in this analysis. (B) Volcano plot depicting differential gene expression between wild-type and tgfbR2 morphants in log2-fold change with a significance level of p < 0.05. Vertical broken lines limit the absolute logFC larger than 0.5-fold change range, whereas the horizontal broken line represents the false discovery rate (FDR) threshold set at FDR < 0.1. The genes where FDR < 0.1 are shown as orange dots. The size of the dots is proportional to mRNA expression levels. (C) Hierarchical clustering of genes expressed with FDR < 0.1 in each of the six biological replicates analyzed (wild-type, wt1 to wt6; tgfbR2MO1, mo1 to mo6). Results are normalized and presented as Z scores from -2 (downregulated) to 2 (upregulated). (D) Schematic representation of the sorting of kdrl:GFP+ cells in wild-type and tgfbR2 morphants (MO) by fluorescence-activated cell sorting to isolate mRNA and validate the NanoString results by qPCR. (E and F) qPCR of p53, cdkn1a, rspo1, and bax in (E) kdrl:GFP+ cells and (F) kdrl:GFP- cells of wild-type and tgfbR2 morphants (MO) at 28 hpf. Taz was omitted from the analysis as its fold induction <2. (G and G′) TUNEL-stained apoptotic cells in uninjected (control) kdrl:GFP embryos at 30 hpf. (H and H′) Apoptotic cells in tgfbR2MO1-injected kdrl:GFP embryos at 30 hpf. White arrows, apoptotic endothelial cells; outline arrows, apoptotic non-endothelial cells. (I and J) qPCR for jag1a in (I) kdrl:GFP- cells and (J) in kdrl:GFP+ cells at 28 hpf. See also Figure S5 and Table S1. |
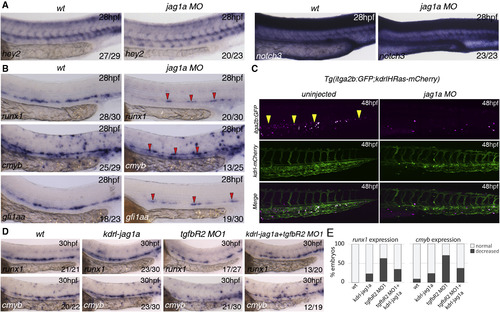
Jag1a Is Required Downstream of TGF² Signaling for HSC Specification (A) Expression of arterial markers in jag1aMO is unaffected when compared to wild-type embryos. (B) Expression of runx1, cmyb, and gfi1aa in wild-type and jag1a morphants (MO) at 28 hpf. All the markers analyzed are reduced or absent in jag1a morphants. Red arrowheads indicate the remaining gene expression in the floor of the DA of jag1a morphants. (C) HSPCs (yellow arrowheads) are severely reduced in the CHT of itga2b:GFP;Kdrl:HsRas-mCherry transgenic embryos at 48 hpf injected with the jag1aMO. Itga2b:GFP+ cells, magenta; Kdrl-HsRas:mCherry+ cells, green. (D) Overexpression of jag1a with a Kdrl:jag1-V5 construct partially rescues the loss of runx1 and cmyb in the floor of the DA. 15 pg of the construct was used for this experiment. The numbers of embryos are shown in each panel as the number of embryos with phenotype/total number analyzed. (E) Quantitation of the rescue effect observed in (D). See also Figure S6. |
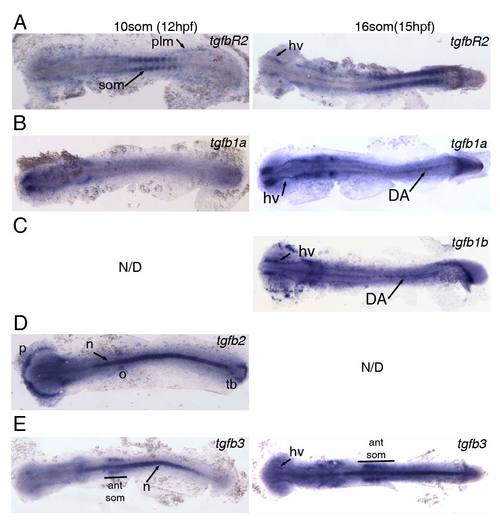
Expression of TGFβ signalling components at 12hpf (10somite stage) and 15hpf (16somite stage). All embryos were flatmounted for imaging. (A) Expression of tgfbR2 in the somites (som) and posterior lateral mesoderm (plm) at 12hpf. Expression of tgfbR2 at 15hpf in head vasculature (hv) and somites. (B) tgfb1a is not expressed in the posterior at 12hpf but is present in head vasculature from 12hpf and in the embryonic dorsal aorta (DA) at 15hpf. (C) tgfb1b is also present in the head vasculture and DA at 15hpf. Note that there is anterior expression of tgfb1b in cells that are likely myeloid. (D) tgfb2 is expressed in the polster (p), otic vesicles (o), notochord (n) and in the tailbud (tb) at 12hpf. (E) Expression of tgfb3 in the notochord and in the 4 anteriormost somites (ant som) at 12hpf. At 15hpf, the expression in the somites and notchord is maintained and weak expression in the head vasculature is observed. EXPRESSION / LABELING:
|
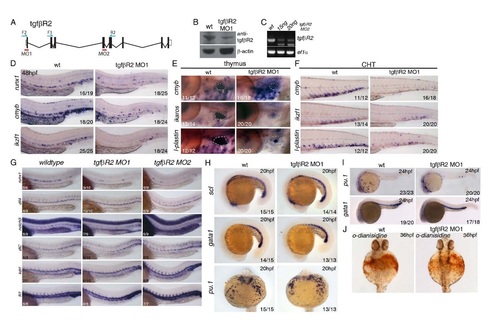
Further characterization and validation of two independent morpholinos targeting tgfβR2 and analysis of primitive haematopoiesis in tgfβR2 morphants. (A) Schematic representation of the genomic organization of the tgfbR2 gene, location of morpholinos and primers used to validate the morpholinos. (B) Western blot against TgfβR2 showing a decrease of WT protein induced by the tgfbR2MO1 morpholino. (C) Validation of the tgfbR2MO2 by qPCR on 24hpf cDNA with tgfbR2 F2/R2 primers (see below). Ef1a PCR was used as a control for the PCR. (D) Expression of runx1, cmyb and ikzf1 at 48hpf is reduced in the trunk and CHT of tgfbR2 morphants. Expression of cmyb, ikzf1 and lplastin is severely reduced (E) in the thymus and (F) in the CHT of tgfbR2 morphants at 4dpf. (G) Characterisation of the tgfbR2 MO1 and MO2 morpholinos. Runx1 expression is decreased upon injection of either morpholino, whereas the arterial markers dll4, notch3 and dlC and the vascular markers kdrl and fli1 are grossly normal. (H) Expression of scl, gata1 and pu.1 is indistinguishable between wildtype and tgfbR2 morphant embryos at 20hpf. (I) Expression of the primitive hematopoietic markers gata1 and pu.1 is unaffected in tgfbR2 morphants at 24hpf. (J) tgfbR2 morphants show a slight reduction in odianisidine staining at 36hpf. Numbers of embryos analysed are shown in each panel as number of affected embryos/total observed. |
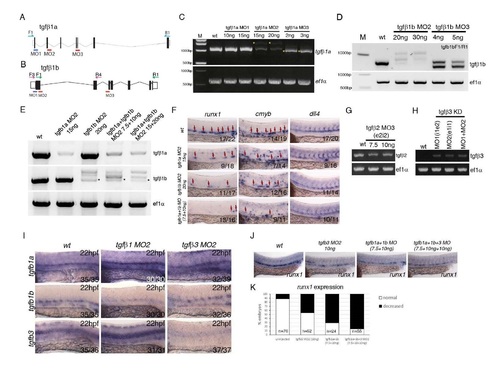
Validation of morpholinos targeting tgfβ1a, tgfβ1b, tgfβ2 and tgfβ3 and further characterization of the phenotype. (A) Schematic representation of the genomic organization of the tgfb1a gene, location of morpholinos and primers used to validate morpholino activity. (B) Schematic representation of the genomic organization of the tgfb1b gene, location of morpholinos and primers used to validate morpholino activity. (C) Validation of the activity of the tgfb1a morpholinos by PCR. Yellow asterisk marks PCR products generated as a result of aberrant splicing induced by the tgfb1a morpholinos MO2 and MO3. We have used tgfb1aMO2 in all of the subsequent analysis. (D) Validation by PCR of the activity of two antisense morpholinos targeting tgfb1b. Clear aberrant splicing was induced by tgfb1b morpholinos MO2 and MO3. We have used tgfb1bMO2 in all of the subsequent analysis. (E) Validation by PCR of the tgfb1aMO2+tgfb1bMO2 combination. Asterisk marks the remainder of the normally spliced tgfb1b gene product. (F) Testing the tgfb1a+tgfb1b MO2 combinations by in situ hybridisation against HE markers runx1, HSPC marker cmyb and arterial marker dll4 at 28hpf. The combination of tgfb1a+tgfb1b MO2 (referred to in the main text as tgfb1MO) was used at 7.5 ng/µl +10ng/µl throughout the manuscript. Numbers of embryos analysed are shown in each panel as number of affected embryos/total observed. (G) Validation by PCR of the activity of a morpholino targeting tgfb2. (H) Validation by PCR of the activity of two published morpholinos (Cheah et al, 2010) targeting tgfb3. Tgfb3MO2 was used in all of the subsequent analysis. (I) Expression of tgfb1a, tgfb1b and tgfb3 in tgfb1MO2 and tgfb3MO2 at 22hpf. tgfb1MO2 morphants show an increase in tgfb1a and tgfb3 and a decrease in tgfb1b; tgfb3MO2 morphants show a dramataic loss of tgfb3 expression. Numbers of embryos analysed are shown in each panel as number of affected embryos/total observed. (J,K) Comparison and quantification of the runx1 expression in the DA upon single tgfb3MO2, tgfb1MO2 or combined tgfb3MO2+tgfb1MO2, showing increased severity of the phenotype in the triple morphants as compared to single morphants. The numbers of embryos analysed are shown in the graph in (K). |
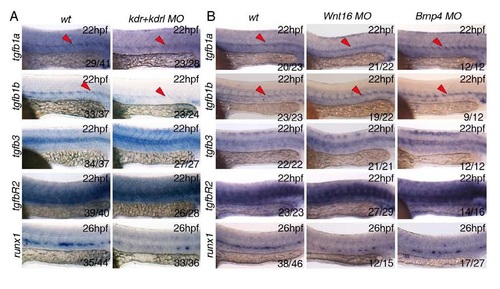
Inhibition of Vegf (kdr+kdrlMO), Wnt (Wnt16MO) or BMP (BMP4MO) signalling pathways by morpholino oligonucleotides. All in situ hybridisation experiments were performed at 22hpf except for the runx1 probe, performed at 26hpf. (A) Loss of Vegf signalling upon morpholino knockdown of the Vegf receptors kdrl and kdrl (Bahary et al, 2007) results in decreased expression of tgfb1a and tgfb1b in the dorsal aorta (DA). Runx1 expression in the DA was used as a positive control for the experiment. (B) Loss of Wnt signalling or BMP signalling by morpholino knockdown of Wnt16 (Clemens et al, 2011) or BMP4 (Chocron et al, 2007) showed no effect of expression of TGFβ ligands or receptor. Runx1 expression in the DA was used as a positive control for the experiment. Numbers of embryos analysed are shown in each panel as number of affected embryos/total observed. |
Reprinted from Developmental Cell, 38(4), Monteiro, R., Pinheiro, P., Joseph, N., Peterkin, T., Koth, J., Repapi, E., Bonkhofer, F., Kirmizitas, A., Patient, R., Transforming Growth Factor β Drives Hemogenic Endothelium Programming and the Transition to Hematopoietic Stem Cells, 358-70, Copyright (2016) with permission from Elsevier. Full text @ Dev. Cell