
- Title
-
Combretastatin A-4 efficiently inhibits angiogenesis and induces neuronal apoptosis in zebrafish
- Authors
- Shi, Y.W., Yuan, W., Wang, X., Gong, J., Zhu, S.X., Chai, L.L., Qi, J.L., Qin, Y.Y., Gao, Y., Zhou, Y.L., Fan, X.L., Ji, C.Y., Wu, J.Y., Wang, Z.W., Liu, D.
- Source
- Full text @ Sci. Rep.
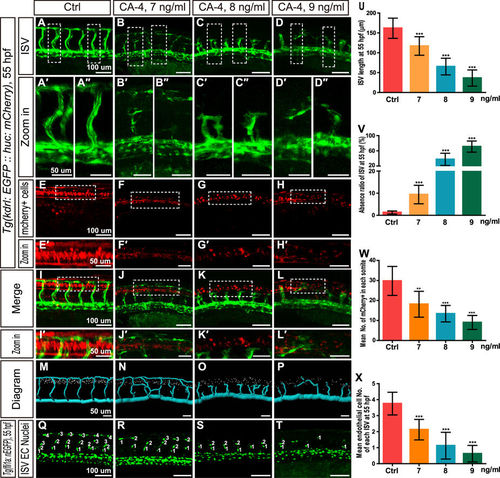
Effects of CA-4 treatment on vascular and central nervous systems in the trunk of Tg(kdrl:EGFP::huc:mcherry) and Tg(fli1a:nEGFP) zebrafish embryos at 55 hpf. (A–D) ISV phenotypes of control group and 7, 8, 9 ng/ml CA-4 treated groups. Scale bar, 100 μm. (A′–D″) Zoomed in images of regions in dash line rectangles of panel (A–D). Scale bar, 50 μm. (E–H) mCherry positive cells in neural tubes of control group and 7, 8, 9 ng/ml CA-4 treated groups. Scale bar, 100 μm. (E′–H′) Zoomed in images of regions in dash line rectangles of panel E-H. Scale bar, 50 μm. (I–L) Merged images of (A–H). Scale bar, 100 μm. (I′–L′) Zoomed in images of regions in dash line rectangles of panel I-L. Scale bar, 50 μm. (M–P) Diagrams of ISVs and neuronal precursor cells in different groups. Scale bar, 50 μm. (Q–T) Endothelial nuclei of control group and 7, 8, 9 ng/ml CA-4 treated groups. Scale bar, 100 μm. (U–X) Statistical analyses of ISV length, ISV absence ratio, number of neuronal precursor cell in each somite, and mean endothelial cell number of each ISV in control group and 7, 8, 9 ng/ml CA-4 treated groups. Data were expressed as the mean ± S.E.M. (n = 8). **P < 0.01 and ***P < 0.001 vs. control group. |
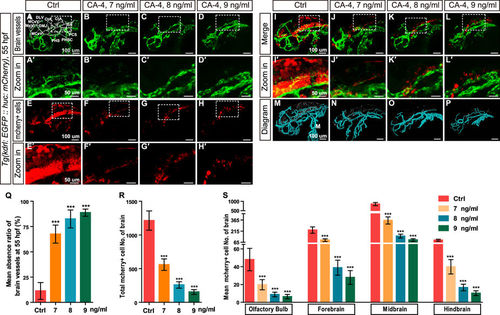
Effects of CA-4 treatment on vascular and central nervous systems in the brain of Tg(kdrl:EGFP::huc:mcherry) embryonic zebrafish at 55 hpf. (A–D) Phenotypes of brain vessel in control group and 7, 8, 9 ng/ml CA-4 treated groups. Scale bar, 100 μm. Brain vessels dorsal longitudinal vein (DLV), dorsal midline junction (DMJ), middle cerebral vein (MCeV), mesencephalic vein (MsV), central artery (CtA), basilar artery (BA), posterior communicating segment (PCS), primordial hindbrain channel (PHBC), and primary head sinus (PHS) were statistically analyzed. (A′–D′) Zoomed in images of regions in dash line rectangles of panel A–D. Scale bar, 50 μm. (E–H) mCherry positive cells in brain of control group and 7, 8, 9 ng/ml CA-4 treated groups. Scale bar, 100 μm. (E′–H′) Zoomed in images of regions in dash line rectangles of panel E-H. Scale bar, 50 μm. (I–L) Merged images of (A–H). Scale bar, 100 μm. (I′-L′) Zoomed in images of regions in dash line rectangles of panel I-L. Scale bar, 50 μm. (M–P) Diagrams of brain vessels and neuronal precursor cells. Scale bar, 100 μm. (Q–S) Statistical analyses of mean absence ratio of brain vessels, Number of neuronal precursor cell in brain, Olfactory bulb, forebrain, midbrain and hindbrain in control group and 7, 8, 9 ng/ml CA-4 treated groups. Data were expressed as the mean ± S.E.M. (n = 8). ***P < 0.001 vs. control group. |
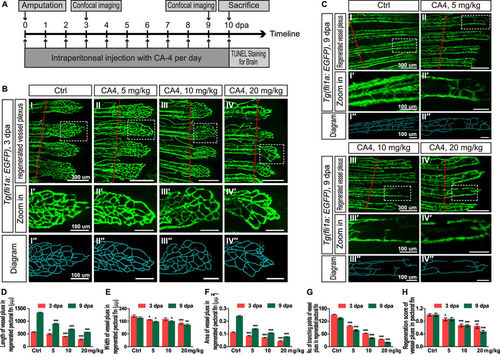
Effects of CA-4 treatment on vessel plexus in regenerated pectoral of Tg(f li1a:EGFP) adult zebrafish at 3 dpa and 9 dpa. (A) The design and pipeline of the experiments. (BI–IV) Vessel plexus in regenerated pectoral fin of control group and 5, 10, 20 mg/kg CA-4 treated groups at 3 dpa. Scale bar, 300 μm. The amputation sites were marked with red lines. (BI′–IV′) Zoomed in images of regions in dash line rectangles of panel B I–IV. Scale bar, 100 μm. (BI″–IV″) Diagrams of vessel plexus in regenerated pectoral fin generated with Imaris software. Scale bar, 100 μm. (CI–IV) Vessel plexus in regenerated pectoral fin of control group and 5, 10, 20 mg/kg CA-4 treated groups at 9 dpa. Scale bar, 300 μm. The amputation sites were marked with red lines. (CI′–IV′) Zoomed in images of regions in dash line rectangles of panel H-K. Scale bar, 100 μm. (CI′′–IV′′) Diagrams of vessel plexus in regenerated pectoral fin generated with Imaris software. Scale bar, 100 μm. (D–H) Statistical analyses of the length, width, area, branching points and regeneration score of vessel plexus in regenerated pectoral fin of control group and 5, 10, 20 mg/kg CA-4 treated groups at 3 and 9 dpa. Data were expressed as mean ± S.E.M. (n = 8). *P < 0.05, **P < 0.01 and ***P < 0.001 vs. control group. |
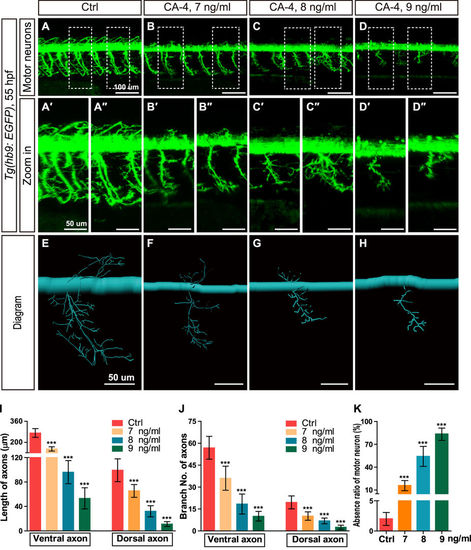
Effects of CA-4 treatment on motor neurons in the Tg(hb9:EGFP) embryonic zebrafish at 55 hpf. (A–D) Phenotype of motor neuron in control group and 7, 8, 9 ng/ml CA-4 treated groups at 55 hpf. Scale bar, 100 μm. (A′–D″) Zoomed in images of regions in dash line rectangles of panel A-D. Scale bar, 50 μm. (E–H) Diagrams of motor neurons. Scale bar, 50 μm. (I–K) Statistic analyses of the length and branch number of ventral and dorsal axons, as well as absence ratio of motor neurons in control group and 7, 8, 9 ng/ml CA-4 treated groups at 55 hpf. Data were expressed as the mean ± S.E.M. (n = 8). ***P < 0.001 vs. control group. |
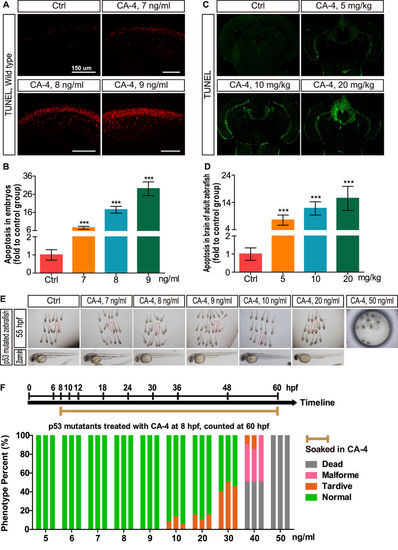
Cell apoptosis in central nervous system induced by CA-4 treatment. (A,C) Cell apoptosis in spinal cord of zebrafish embryos and brain section stained with TUNEL reagent of adult zebrafish. (B,D) Statistical analyses of cell apoptosis in central nervous system of embryonic and adult zebrafish. Data were expressed as mean ± S.E.M. (n = 4). ***P < 0.001 vs. control group. (E) The bright field images of p53 mutated embryonic zebrafish in control group and 7, 8, 9 ng/ml CA-4 treated groups at 55 hpf. (F) Percentage of phenotype in p53 mutants induced by 5–50 ng/ml CA-4 treatment at 8 hpf, analyzed at 60 hpf. The experiments of CA-4 treatment at each concentration were repeated in triplicate. The percentage of Dead, Malformed, Tardive and Normal was displayed in Grey, Pink, Orange and Green columns, respectively. |
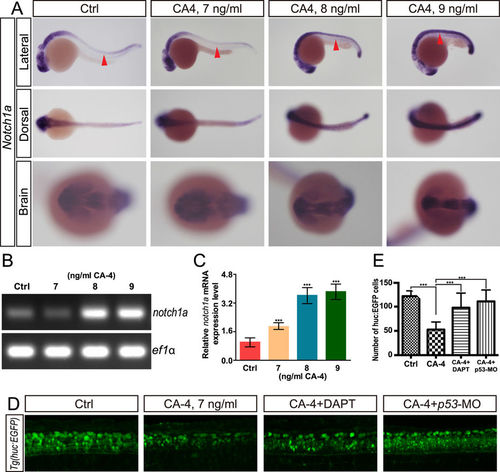
CA-4 treatment caused norch1a up regulation. (A) Whole-mount in situ hybridization analysis of notch1a expression in control embryo and CA-4-treated embryo. Red arrowhead indicates neural tube. (B) RT-PCR analysis of notch1a expression in control embryo and CA-4-treated embryo. (C) Real-time PCR analysis of notch1a expression in control embryo and CA-4-treated embryo. (D) Confocal analysis of CA-4-treated Tg (huc:EGFP) embryo. (E) Statistical analyses of EGFP positive cells in central nervous system of control, CA-4-treated, CA-4 and DAPT treated, and CA-4 treated p53 knockdown embryo. (n = 6), ***P < 0.001. |
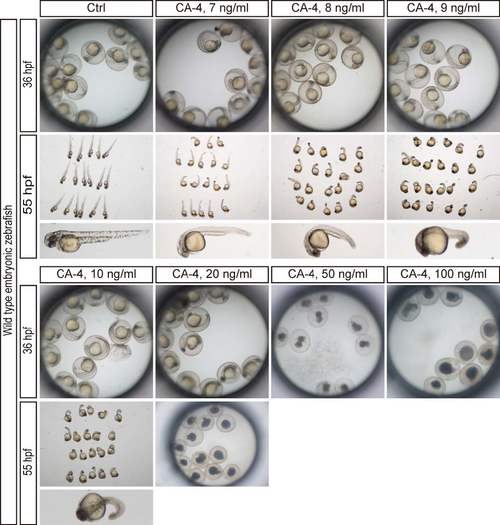
Phenotype of embryonic zebrafish induced by CA-4 treatment at 36 hpf and 60 hpf. The experiments of CA-4 treatment at each concentration were repeated in triplicate. |
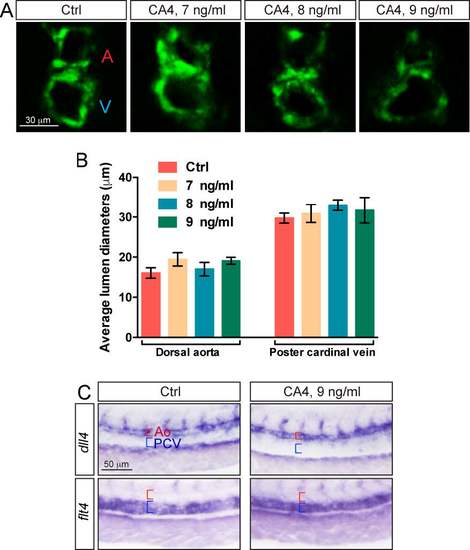
The lumen size of DA and PCV were not significantly changed in CA-4 treated zebrafish embryos. (A) Cross-section of Tg(kdrl:EGFP) control zebrafish embryos and embryos treated with CA-4 at different concentrations. (B) The statistics of DA and PCV lumen size, error bars indicate s.e.m. (20 embryos were analyzed for each group). (C) Whole-mount in situ hybridization analysis in 30 hpf control and CA-4 treated zebrafish embryos using flt4 (n=12) and dll4 (n=15) antisense probes. |
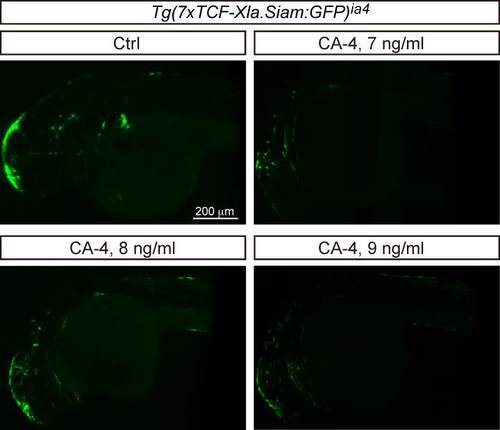
Confocal analysis of EGFP expression in CA-4 treated Tg(7xTCF-Xla.Siam:GFP)ia4 embryos. |
|
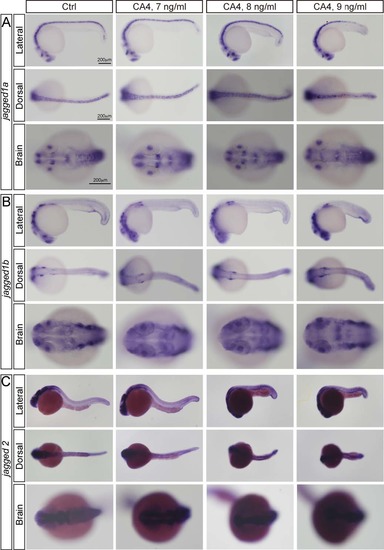
Whole- mount in situ hybridization analysis of jaggged1a, jagged1b, jagged2, dltc, notch2 and notch3 expression in control embryo and CA-4- treated embryo. 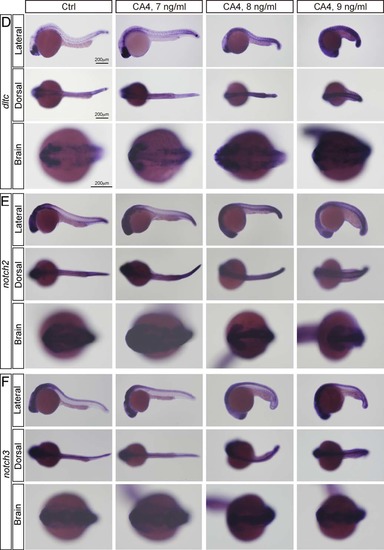
|
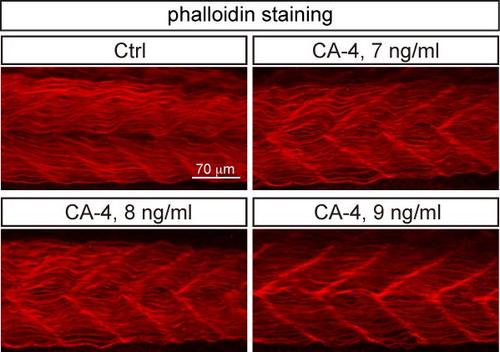
Confocal imaging analysis of zebrafish somites of CA-4 treated embryos stained with Phalloidin, showing the muscle fibers. |