
- Title
-
Dynamic phosphorylation of Histone Deacetylase 1 by Aurora kinases during mitosis regulates zebrafish embryos development
- Authors
- Loponte, S., Segré, C.V., Senese, S., Miccolo, C., Santaguida, S., Deflorian, G., Citro, S., Mattoscio, D., Pisati, F., Moser, M.A., Visintin, R., Seiser, C., Chiocca, S.
- Source
- Full text @ Sci. Rep.
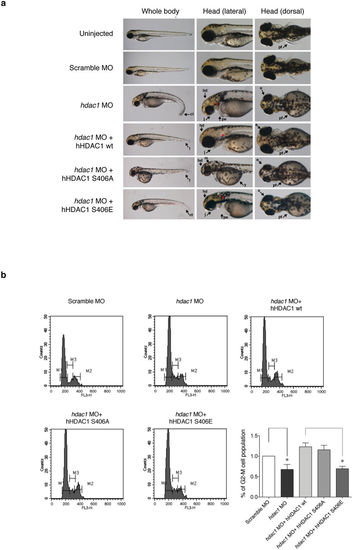
Aurora-driven phosphorylation of HDAC1 is crucial for zebrafish developmental plan and modulates proliferation in hdac1 morphant zebrafish embryos. (a,b) Embryos were injected, at one cell stage, with Scramble MO or hdac1 MO alone or in combination with hHDAC1 aurora phospho mutants and collected at 72 hours post fertilization (hpf). (a) Lateral and dorsal overviews of zebrafish embryos at 72 hpf. Arrows highlight morphological differences between embryos. hd: head, m: head melanocytes, j: jaw, e: eye, pe: pericardial edema, y: yolk, pf: pectoral ns, t: tail, ct: curled down tail, *: otoliths. (b) Flow cytometry analysis by PI staining of cell suspensions prepared from 72 hpf heads of control embryos and embryos injected at one-cell stage with hdac1 MO alone or in combination with hHDAC1 wt, hHDAC1 S406A or hHDAC1 S406E. The percentage of G2-M cells population compared with the control is reported for every sample. The average of three independent experiments was reported, standard error (SEM) was indicated by the error bars; the significance was calculated by one sample t-test algorithm. *P value < 0.05. PHENOTYPE:
|
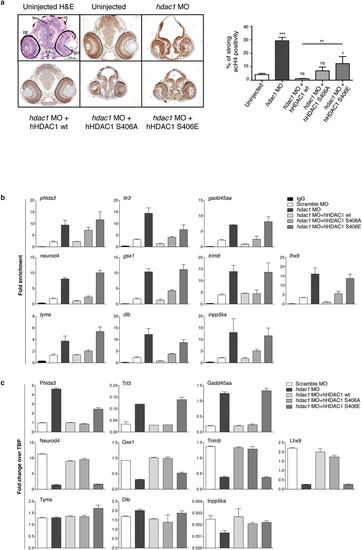
Aurora dependent phosphorylation of HDAC1 modulates histone acetylation and the expression of a core of CNS-related genes in zebrafish embryos. (a–c) Embryos were injected, at one cell stage, with Scramble MO (b,c) or hdac1 MO alone or in combination with hHDAC1 aurora phospho mutants and collected at 72 hpf. (a) Immunohistochemistry staining with haematoxylin and eosin (H&E uninjected panel: d: diencephalon; pe: pigmented epithelium; tr: trabecular; rc: rods and cones; gcl: ganglion cell layer; i: iris; m: melanocytes; bv: brain ventricle) and with haematoxylin (blue) and anti-acetylated histone antibody (brown). Quantification was performed and expressed as percentage of strong positive histone H4 acetylated pixels ± SEM in the diencephalon area. All samples were compared to uninjected sample and in particular hdac1 MO + hHDAC1 S406E was also compared to hdac1 MO + hHDAC1 wt. **P value < 0.01; ***P value < 0.001; ns: not significant. Scale bar corresponds to 100 μm. (b) Chromatin immunoprecipitation (ChIP) analysis of H3K27 acetylated cis-regulatory regions of Hdac1-regulated genes. Representative data from at least two independent experiments are shown; RTqPCR data are presented as mean ± S.E.M. of three replicates. (c) Gene expression analysis of Hdac1-regulated genes. Representative data from three independent experiments are shown; RTqPCR data are presented as mean ± S.E.M. of three replicates. TBP is used as housekeeping. EXPRESSION / LABELING:
PHENOTYPE:
|