
- Title
-
Oscillatory Flow Modulates Mechanosensitive klf2a Expression through trpv4 and trpp2 during Heart Valve Development
- Authors
- Heckel, E., Boselli, F., Roth, S., Krudewig, A., Belting, H. G., Charvin, G., Vermot, J.
- Source
- Full text @ Curr. Biol.
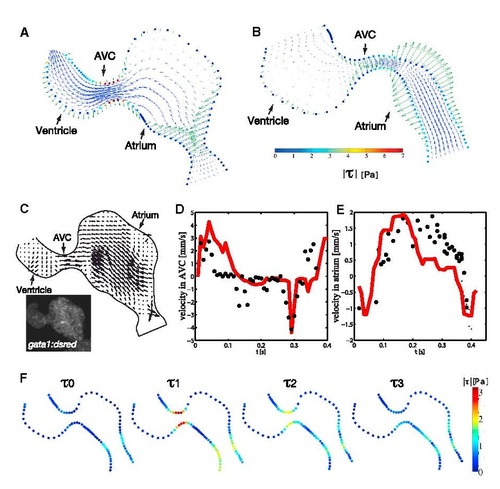
Oscillatory Flow Has a Stereotypical Distribution in the Embryonic Heart (A and B) Instantaneous flow field (blue flow arrows) and wall shear stress magnitude |τ| (color-coded dots marking the wall) during forward (A) and reversing (B) flow, as predicted by our model. Green arrows show the estimated wall velocity vectors imposed as boundary conditions. (C) In vivo flow measurement using Tg(gata1:dsred) embryos and PIV was used to test the model. (D and E) Velocity magnitude through the center of the AVC (D) and atrium (E) versus time. Negative velocities denote reversing flow. Solid red line, model prediction; black dots, in vivo particle tracking. (F) Frequency content (up to f = 3f1) of the WSS at several control points at the wall. τn is the amplitude of the frequency f = nf1 (τ0 and τ1 correspond to the average shear stress and the fundamental frequency f1, respectively). See also Movies S1 and S2. EXPRESSION / LABELING:
|
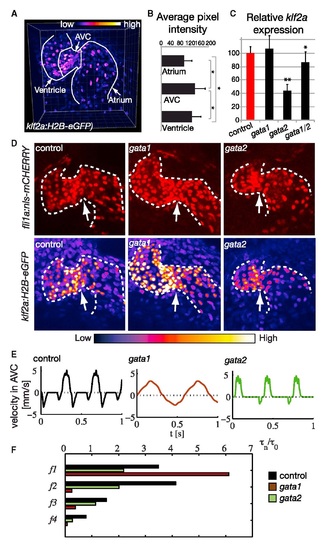
The Oscillatory Flow Amplitude Dictates klf2a Expression Level (A) klf2a expression pattern in the Tg(klf2a:H2B-eGFP) line. (B) Relative fluorescence level of the klf2a transgene in the atrium, AVC, and ventricle at 48 hpf. Error bars indicate the SD. (C) Relative expression level of Tg(klf2a:H2B-eGFP) in gata1 (n = 7), gata2 (n = 6), and gata1/gata2 (n = 5) morphants in the AVC, at 48 hpf. **p < 0.01 ANOVA. Error bars indicate the SD. (D) Maximum projection images of Tg(fli1a:nls-mcherry) and Tg(klf2a:H2B-eGFP) hearts from control, gata1, and gata2 knockdown embryos. The white arrow points to the AVC. The GFP signal is shown as FireLUT to aid visualization of low signal intensity. The intensity scale is shown below the panels. (E) Typical flow profiles (velocity magnitude against time) measured in the AVC of control and gata2 and gata1 knockdown hearts at 48 hpf. Negative values denote flow reversal from the ventricle to the atrium. (F) Amplitude of the harmonic index τn/τ0 for the flow profile in (E), with τn the amplitude of the frequency harmonic f = nf1, f1 the fundamental frequency, and τ0 the average shear stress. See also Figures S1 and S2 and Movie S3. |
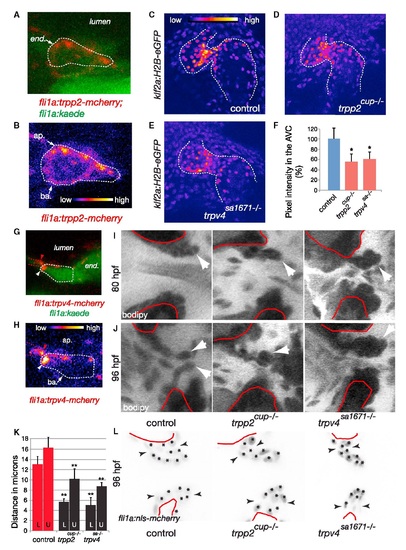
Trrp2 and Trpv4 Are Essential for klf2a Expression and Heart Valve Development (A) Subcellular distribution of Trpp2 in the endocardium (Tg(fli1a:kaede) in green) and of Tg(fli1a:trpp2-mcherry) in red. (B) Zoom on the Tg(fli1a:trpp2-mcherry) endocardial cell (FireLUT). (C and D) Tg(klf2a:H2B-eGFP) expression level in trpp2cup-/- embryos (n = 6) is lower than in the control (n = 10) in the endocardium (C) and corresponds to a 45% decrease in klf2a:H2B-eGFP expression after pixel intensity measurement at 48 hpf (D). (E and F) trpv4sa1671-/- (n = 6) also displays a significant decrease of the klf2a transgene intensity in the AVC (38% decrease) compared to the control at 48 hpf. (E) Quantification of the fluorescence intensity of the H2B-eGFP in the controls, trpp2cup-/-, and trpv4sa1671-/- mutants at 48 hpf. *p < 0.05; **p < 0.01 ANOVA. Error bars indicate the SD. (G and H) Subcellular distribution of Trpv4 in the endocardium (Tg(fli1a:kaede) in green) and of Tg(fli1a:trpv4-mcherry) in red. (H) Zoom on the Tg(fli1a:trpv4-mcherry) endocardial cell (LUT fire). Endocardial cells are highlighted with dotted lines showing Trpv4 channels are enriched apically. (I and J) Heart valve defects in trpp2cup-/- and trpv4sa1671-/- at 80 and 96 hpf. The tip of the valve is highlighted by the white arrows, and the red lines indicate the separation between the myocardium and endocardium. (K) Length of the base of the upper (U) and lower (L) valve in the section plan (shown with the black arrows in K) showing the shape base of the valve is affected in the trpp2 and trpv4 mutants at 96 hpf. **p < 0.01 ANOVA. Error bars indicate the SD. (L) Nuclear labeling of the endocardial cells located in the AVC and forming the valve leaflets at 96 hpf in controls, trpp2cup-/-, and trpv4sa1671-/-; Tg(fli1a:nls-mcherry) mutants showing the cellular localization in normal and mutant valves. The black arrows point to the base of the upper and lower valves. ap., apical; ba., basal; end., endocardium; myoc., myocardium (A, B, I, and J). See also Figure S3 and Movie S4. |
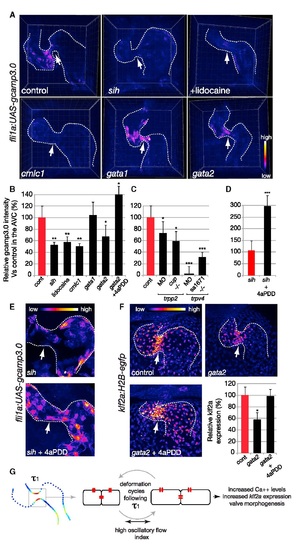
Endocardial Intracellular Calcium Level Correlates with the Intracardiac FH Index and Depends on TRPs Channels Function (A and B) Calcium level quantification in the embryonic heart of controls (n = 10), mutants of heart contraction (cmlc1 knockdown; n = 3), lidocaine-treated embryos (n = 3), gata1 (n = 3), gata2 (n = 6) MO, and gata2 MO plus 4α-PDD (n = 2). At 48 hpf, fishes with a reduced oscillatory flow index (sih, lidocaine, cmlc1, and gata2) show a significant reduction of intracellular calcium intensity in the AVC (white arrow), whereas the specific ligand of TRPV4 (4α-PDD) channels restores an almost normal intracellular calcium intensity in the AVC of the gata2 MO. *p < 0.05; **p < 0.01 ANOVA. Error bars indicate the SD. (C) Calcium level quantification in the embryonic heart of control, trpp2 MO (n = 3), trpp2cup-/- (n = 6), trpv4 MO (n = 6), and trpv4sa1671-/- (n = 2) embryos. Error bars indicate the SD. (D) 4α-PDD induces an increase in intracellular calcium in the absence of flow in the Tg(fli1a:gcamp3.0), sih (n = 5) hearts. ***p < 0.001 t test. Error bars indicate the SD. (E) Confocal micrograph showing the effect of 4α-PDD on calcium signaling in sih. (F) Confocal micrograph and intensity quantification of klf2a:H2B-eGFP intensity in gata2 knockdown with and without 4α-PDD treatment (n = 9 and n = 3, respectively). Error bars indicate the SD. (G) Schematic highlighting a potential mechanism for oscillatory flow mechanodetection by the TRP channels (in red) specifically in the AVC. |
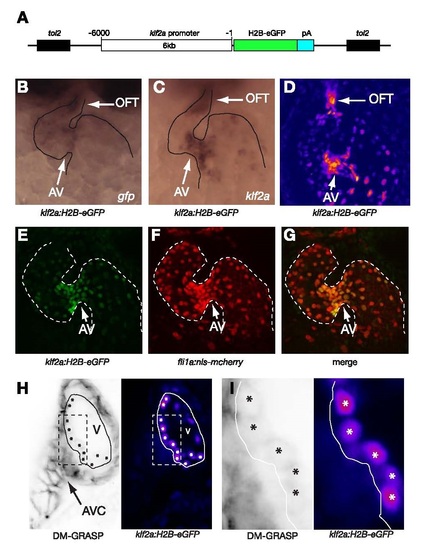
Zebrafish klf2a reporter line. A. Generation of the Tg(klf2a:H2B-eGFP) line. A 6 kb fragment of the region upstream of klf2a ATG located between -1 and -6000 bp (with the ATG being considered as 0 in the drawing) was cloned into a PCAAGS vector containing a cassette driving H2B-eGFP expression and the tol2 sites. Several founders were obtained and only two were kept for further analysis. As both of them recapitulated the same expression pattern, only one line was maintained for the study. (B-C) gfp and klf2a whole mount in situ hybridization (ISH) expression in larvae at 2 dpf. Frontal views reveal staining of the outflow tract (OFT) and the atrio ventricular canal (AVC). (D) Maximum intensity projection of a confocal stack of Tg(klf2a:H2B-eGFP) larva revealing GFP expression in the atrioventricular canal and the outflow tract at 52 hpf. (E-G) Maximum intensity projection of a confocal stack of Tg(klf2a:H2B-eGFP;fli:nls-mcherry). The Tg(klf2a:H2B-eGFP) (E) and the Tg(fli1a:nls-mcherry) which is specifically expressed in the endocardial cell layer (F) display a strict co-localised expression in the merge (G). This reveals the specificity of expression Tg(klf2a:H2B-eGFP) in the endocardium. (H-I) Maximum projection of the outside curvature of the ventricle after immunohistochemistry done with DM-GRASP antibodies labeling the endocardial and myocardial AVC cells in the Tg(klf2a:H2B-eGFP). The expression of DM GRASP and H2B EGFP co-localises in this area, thereby showing that cells of the outer curvature of the ventricular endocardium are part of the AVC. |

klf2a transgene expression level is decreased by affecting the oscillatory content of the flow in the AVC. (A) Maximum projection images of tg(fli:nls-mcherry) and tg(klf2a:H2B-eGFP) from control (n=11), cmlc1 (n=6), tnnt2a knock down (n=7) and lidocaine treated (n=7) embryos. All show a decreased expression of Tg(klf2a:H2B-eGFP) in the remaining endocardial cells in the AVC (white arrow) by comparison to their control at 48hpf. (B) Fundamental harmonic index (FH index) variation with τ1 and τ0 examples. We compare three cases with different amount of reversing flow but with similar oscillation amplitude. The dotted line highlights the baseline, which is set at 0. τ1 and τ0 amplitude is highlighted on the side bar. τ0 increases when forward flow increases while τ1 does not vary. This directly affects the FH τ1/τ0, which is displayed in the graph. The FH index τ1/τ0 is a good indicator of the amount of reversing flow generated in the beating heart. (C) Summary of the intensity measurements of the klf2a transgene in the AVC at 48hpf for the cases shown in (A). (D, F, G) Quantification of the FH index τ1/τ0 in the AVC for the different flow conditions: in gata1 and gata2 knock down (D), in the tnnt2a knock down, lidocaine treated and cmlc1 knock down embryos (F) and in trpv2 mutant and trpv4 knock down (G). Intensity of the transgene is significantly reduced when the FH index τ1/τ0 is reduced in the AVC. (E) Graph representing the percentage of tg(klf2a:H2B-eGFP) positive cells in controls and gata1 knock down.**P<0.01 ANOVA. |
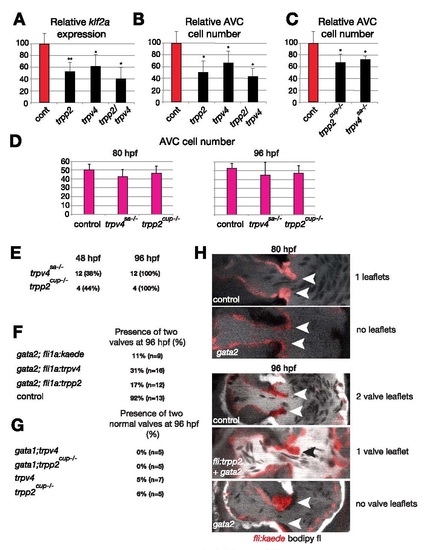
Trpp2 and Trpv4 are essential for valve development. (A-B) Tg(klf2a:H2B-eGFP) relative expression level (A) and relative number of cells counted in the AVC (B) in controls, trpp2, trpv4 and trpv4+trpp2 MO embryos (n=6, 7, 7 and 4, respectively). (C) Relative number of cells counted in the AVC in controls, trpp2cup-/-, and trpv4sa1761-/- at 48 hpf based on Tg(fli1:nls-mcherry) nuclei number in the AVC. (D) Total number of valve cells counted in the AVC in controls, trpp2cup-/-, and trpv4sa1761-/- at 80 and 96 hpf based on Tg(fli1:nls-mcherry) nuclei number in the AVC (see also MovieS4). (E) Single embryo follow up of the valve defects associated with early decrease of cells in AVC. For the trpv4 knock down embryos, 42% (n=5) displayed a 50% decrease of cells in the AVC. All of these embryos had upper and lower valve defects at 96 hpf as described in Figure 3H. For the trpp2 mutant embryos, 55% (n=5) displayed a 32% decrease of cells in the AVC. All of these embryos had upper and lower valve defects at 96 hpf as described in Figure 3H. (F) Table summarizing the valve rescue obtained after overexpression of trpp2 and trpv4 specifically in the endocardium of gata2 knock down embryos. (F) Table summarizing the lack of valve rescue obtained after gata1 knock down in trpp2cup-/- and trpv4 knock down at 96 hpf. (H) Typical phenotypes observed at 80 hpf and 96 hpf to score the rescue of the valve phenotype in gata1 and gata2 knock down. We analyzed Tg(fli:kaede) embryos incubated with bodipy-fl to label the leaflets. |