
- Title
-
Metastatic Colonization Requires the Repression of the Epithelial-Mesenchymal Transition Inducer Prrx1
- Authors
- Ocaña, O.H., Córcoles, R., Fabra, A., Moreno-Bueno, G., Acloque, H., Vega, S.,Barrallo-Gimeno, A., Cano, A., Nieto, M.A.
- Source
- Full text @ Cancer Cell
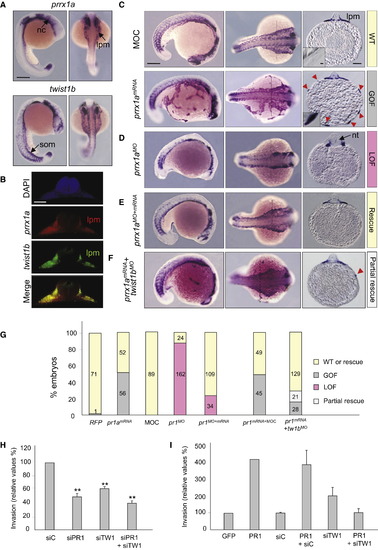
Prrx1 Overexpression Induces Massive Invasion in Zebrafish Embryos (A) Expression of prrx1a and twist1b in zebrafish embryos at the 22-somite stage (lateral and dorsal views). nc, neural crest; lpm, lateral plate mesoderm; som, somites. Scale bar: 200 µm. (B) Double fluorescent ISH of transverse gelatin sections taken at the mid trunk level shows the coexpression of prrx1a and twist1b in the lpm. Scale bar: 50 µm. (C–F) ISH for twist1b to detect lpm cells in zebrafish embryos. Lateral (left), dorsal (middle), and transverse gelatin sections (at the level of the dotted lines, right) view of lpm cells of zebrafish embryos microinjected with a control morpholino (MOC) or prrx1a mRNA (prrx1amRNA) (C), a prrx1a morpholino oligonucleotide (prrx1aMO) (D), prrx1amRNA together with prrx1aMO (E), or twist1bMO together with prrx1amRNA (F). nt, neural tube. Red arrowheads indicate invasive cells in extraembryonic territories. A color code was assigned to the different phenotypes (boxes on the right) as follows: yellow, WT (wild-type) and rescue; gray, GOF (gain of function); pink, LOF (loss of function/knockdown), pale gray, partial rescue. This color code was also used for the quantification of phenotypes shown in (G), Scale bar: 200 µm in left and middle, 100 µm in the right, and 10 µm in the insets. (G) Quantitative analysis of the fish phenotypes shown in (C–F) and that of microinjection of a control mRNA (RFP). (H) Invasive properties of BT-549 human cancer cells after transient downregulation of PRRX1 and/or TWIST1 by siRNA transfection. Invasion is represented relative to that observed in control (siC-treated) BT-549 cells. Histograms represent the mean ± SD of three independent experiments (**p < 0.01 compared to the control condition). (I) Analysis of cell invasion of collagen matrices after ectopic PRRX1 expression (PR1) and/or downregulation of endogenous TWIST1 expression (siTW1) in HBL-100 cells. Histograms represent the mean ± SD of four independent experiments (p = 0.083 PR1+siC versus siC; p = 0.082 PR1+siTW1 versus PR1+siC). PR or pr, PRRX or prrx; TW or tw, TWIST1 or twist, respectively. See also Figure S3. EXPRESSION / LABELING:
PHENOTYPE:
|
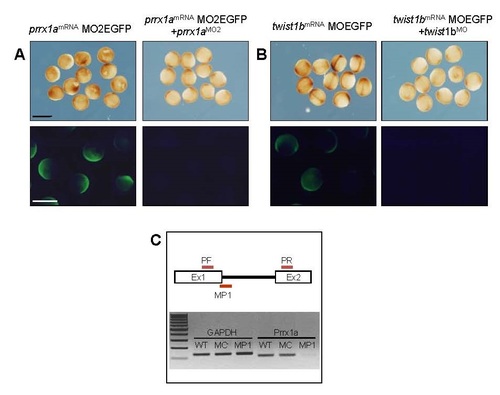
Related to Figure 3. Efficiency and specificity of morpholino antisense oligonucleotides. (A-B) Specificity was assessed by injecting embryos with a morpholino oligonucleotide (MO) against prrx1a or twist1b together with a plasmid containing the sequence of the prrx1aMO (A) or twist1bMO (B) in front of the Egfp gene. Efficiency was directly associated with the decrease in EGFP expression compared with that obtained after injection with the corresponding MO, checked at 10-12hpf by immunohistochemistry with a POD-conjugated antibody and developed with DAB (upper panels) and EGFP fluorescence emission (lower panels, fluorescence pictures taken with the same settings). Scale bar: 1 mm. (C) The efficiency of the prrx1a splice morpholino was assessed in injected embryos by RTPCR amplification with primers from exon1 and 2, which yield a 108 bp fragment; unprocessed mRNA of 2.6 kb long cannot be amplified. The efficiency is directly related to the decrease in the amount of the 108 bp fragment. |
Reprinted from Cancer Cell, 22(6), Ocaña, O.H., Córcoles, R., Fabra, A., Moreno-Bueno, G., Acloque, H., Vega, S.,Barrallo-Gimeno, A., Cano, A., Nieto, M.A., Metastatic Colonization Requires the Repression of the Epithelial-Mesenchymal Transition Inducer Prrx1, 709-724, Copyright (2012) with permission from Elsevier. Full text @ Cancer Cell