
- Title
-
BMP and retinoic acid regulate anterior-posterior patterning of the non-axial mesoderm across the dorsal-ventral axis
- Authors
- Naylor, R.W., Skvarca, L.B., Thisse, C., Thisse, B., Hukriede, N.A., Davidson, A.J.
- Source
- Full text @ Nat. Commun.
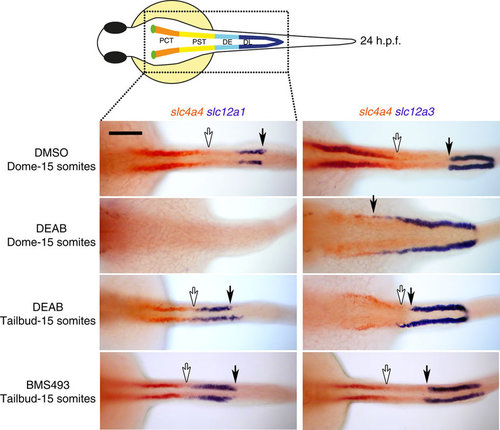
Inhibition of RA signalling affects pronephros segmentation during gastrulation. Whole-mount double in situ hybridization analysis at 24 hours post fertilisation (h.p.f.) for nephron segment markers slc4a4 (red), slc12a1 and slc12a3 (purple) treated with BMS189453, DEAB or DMSO (vehicle control). Embryos are shown as dorsal views with anterior to the left. White arrows indicate posterior end of slc4a4+ domain and black arrows indicate the boundary between the DE and DL segments. Scale bar, 100 µm. |
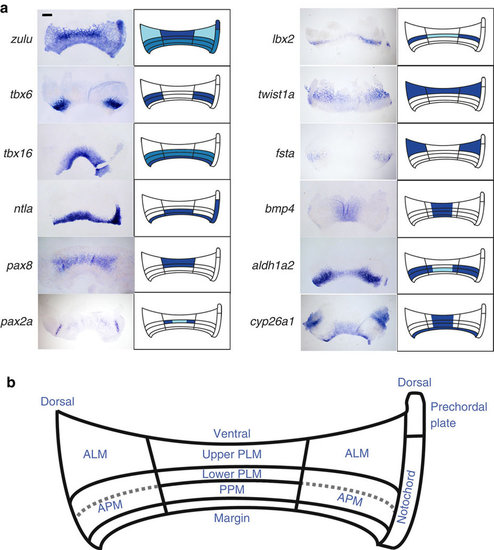
Gene expression analysis of late gastrula embryos reveals distinct ventroposterior and dorsoanterior territories. (a) Whole-mount in situ hybridization analysis for various mesodermal markers as indicated. Embryos were flat-mounted and are orientated with the animal side at the top and vegetal side at the bottom. Only mesodermal expression is highlighted with the exception of bmp4, which is expressed in the epiblast (expression in the hypoblast is unknown). (b) Schematic representation of the late gastrula mesodermal subdivisions. ALM, anterior lateral mesoderm; PPM, posterior paraxial mesoderm. Scale bar, 200 µm. |
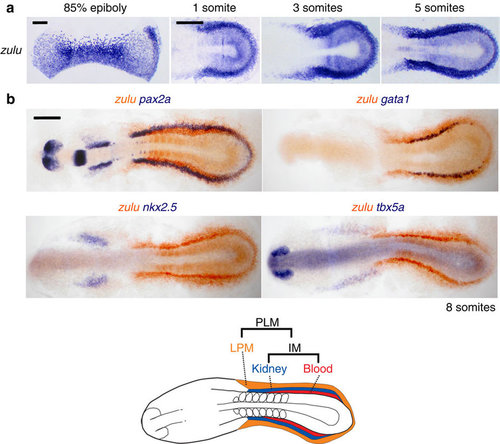
The zulu marker is highly expressed in the PLM. (a) Whole-mount stage series in situ hybridization detecting gene expression of zulu suggest the zuluhigh PLM region at 85% epiboly forms the zuluhigh PLM at somitogenesis stages. All embryos are flat-mounted, 85% epiboly embryos are orientated with animal pole on top and vegetal pole at the bottom, later stages are dorsal views with anterior to the left. (b) Whole-mount double in situ hybridization at the 10-somites stage to detect transcripts for zulu and pax2a/gata1/nkx2.5/tbx5a. All embryos are flat-mounted and shown in dorsal views with anterior to the left. Scale bars, 200 µm. EXPRESSION / LABELING:
|
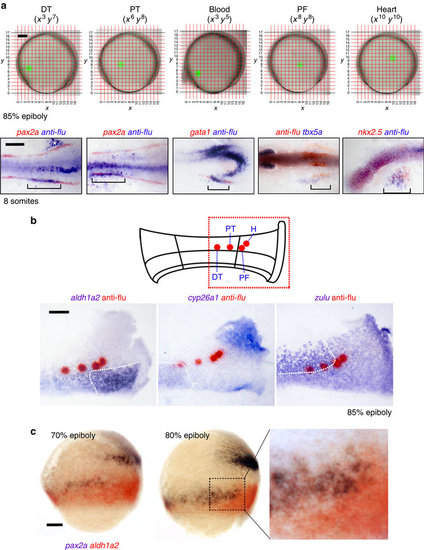
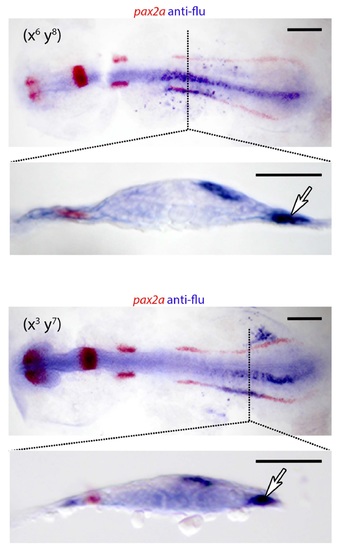
Fate-mapping analysis of late gastrula embryos show proximal tubule and pectoral fin progenitors are juxtaposed to the aldh1a2high domain. (a) Cells on the left-hand side of embryos at the 85% epiboly stage were lineage-labelled at various co-ordinates on the Cartesian grid shown (embryos are orientated with animal pole towards the top and dorsal side to the right). At the 10-somites stage, co-localization of uncaged cells and kidney (pax2a+), blood (gata1+), pectoral fin (tbx5a+) and heart (nkx2.5+) tissues was determined by whole-mount double in situ hybridization. Labelled cells on the right-hand side of the embryo (white asterisk) are the result of the laser passing through the embryo and uncaging cells on the contralateral side. Embryos are flat-mounted with anterior to the left (note: tbx5a is stained purple due to being a weaker probe). (b) Top schematic shows a flat-mounted embryo with the highlighted region corresponding to the panels below and the positions that label progenitors of the proximal (PT) and distal (DT) tubules, pectoral fin (PF) and heart (H). Bottom panels show whole-mount double in situ hybridization of these uncaged populations (red) relative to the expression domains of aldh1a2, cyp26a1 and zulu (purple) at 85% epiboly. (c) Lateral views of 70% (left) and 80% (centre) epiboly-stage embryos double stained for aldh1a2 (purple/black) and pax2a (red) transcripts. Higher magnified view of the indicated region is shown in the right-hand panel. A, animal pole; V, vegetal pole. Schematic at the bottom represents an outline of PLM. IM, intermediate mesoderm; LPM, lateral plate mesoderm. Scale bar in a, 100 µm in top panels and 200 µm in lower panels. Scale bars in b and c, 100 µm. |

Knock down of Cyp26a1 anteriorizes the kidney. Whole-mount double in situ hybridization analysis at 24 hours post fertilisation (h.p.f.) for nephron segment markers slc4a4 (orange), slc12a1 and slc12a3 (purple) in embryos injected with cyp26a1 morpholino or treated with R115866 or DMSO (vehicle control). Embryos are shown as lateral views with anterior to the left. Arrowhead indicates junction between the DE and DL segments. Scale bar, 100 µm. |
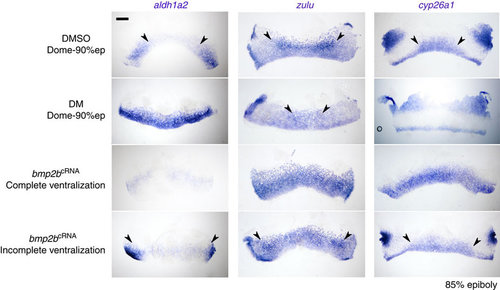
BMP signalling regulates the size of aldh1a2 and cyp26a1 and zulu expression domains. Whole-mount in situ hybridization analysis for aldh1a2, cyp26a1 and zulu at the 85% epiboly stage in embryos treated with DM dihydrochloride, DMSO (vehicle control) or injected with bmp2b mRNA. Embryos are shown flat-mounted and orientated with the animal pole at the top and the vegetal pole at the bottom. Scale bar, 200 µm. EXPRESSION / LABELING:
PHENOTYPE:
|
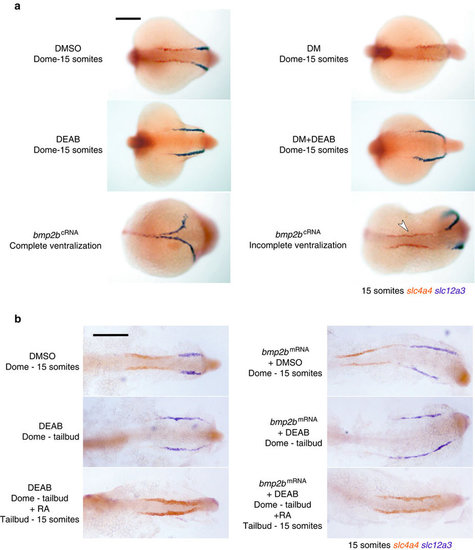
RA acts downstream of the BMP signalling pathway during kidney patterning. (a) Whole-mount double in situ hybridization analysis for nephron segment markers slc4a4 (red) and slc12a3 (purple) in embryos at the 15-somites stage injected with bmp2b mRNA or treated with DM dihydrochloride, DEAB and DMSO (vehicle control) at the indicated stages. Embryos are shown as dorsal views with anterior to the left. (b) Embryos were treated as shown and stopped at the 15-somites stage for double in situ hybridization staining for the anterior pronephros marker slc4a4 and the distal pronephros marker slc12a3. All panels are dorsal views of flatmounted embryos. Scale bar, 200 µm. EXPRESSION / LABELING:
PHENOTYPE:
|
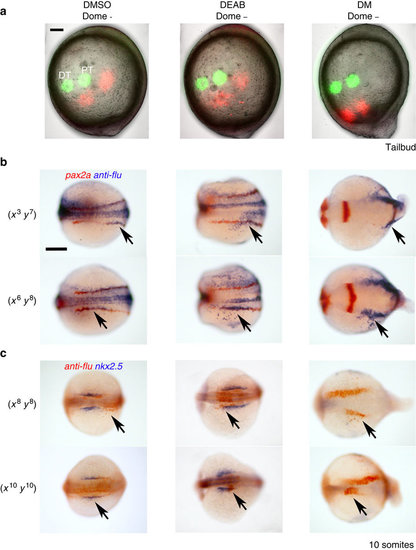
Effects of BMP and RA on cell fate and cell movement. (a) Embryos were lineage labelled for distal (DT) and proximal (PT) cells (green) at 85% epiboly. One hour later the positions of these cells were analysed (pseudo-coloured red) and overlayed with the initial lineage labelling. Embryos are lateral views with anterior towards the top. (b) Uncaging cells at (x3, y7) or (x6, y8) at 85% epiboly labelled DT and PT regions, respectively, of the pax2a+ intermediate mesoderm in DMSO- and DEAB-treated 10-somites stage embryos. In DM-treated embryos, (x3, y7) uncaging labelled anterior intermediate mesoderm and a region we predict corresponds to anterior paraxial mesoderm. DM-treated embryos uncaged at (x6, y8) labelled a region of the embryo that likely was composed solely of anterior paraxial mesoderm. Embryos are shown as dorsal views with anterior to the left. (c) Uncaging at (x8, y8) labelled cells just posterior to heart progenitors in DMSO control embryos at the 10-somites stage, but labelled within the posterior domain of expanded heart progenitors (nkx2.5+ cells) in DEAB-treated embryos. Similarly, (x10, y10) labelled heart progenitors in 10-somites stage DMSO control embryos, but mainly labelled the anterior region of the expanded nkx2.5+ domain in DEAB-treated embryos. In DM-treated embryos, heart progenitors were found to sparsely populate the ventral side of the embryo, and (x8, y8) and (x10, y10) labelling at 85% epiboly gave rise to progressively more anterior structures that were positioned close to the dorsal midline. Embryos are shown as dorsal views slightly oblique such that the anterior head region is in view. Scale bars, 100 µm. Arrows indicate uncaged tracer. |
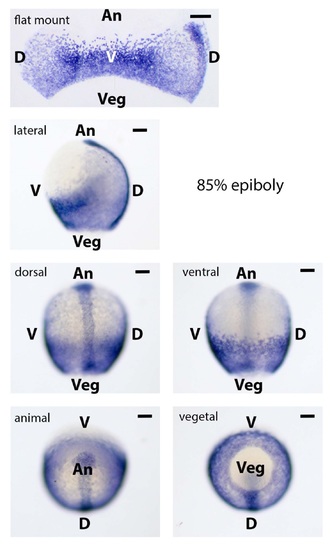
Expression profile of zulu. Detection of zulu transcripts by whole mount in situ hybridization is shown at the 85% epiboly stage in tlatmounted and untlattened embryos. Abbreviations: An, Animal; Veg, Vegetal; D, Dorsal; V, Ventral. Scale bar represents 200 µm in top panel and 100 µm in bottom wholemount panels EXPRESSION / LABELING:
|
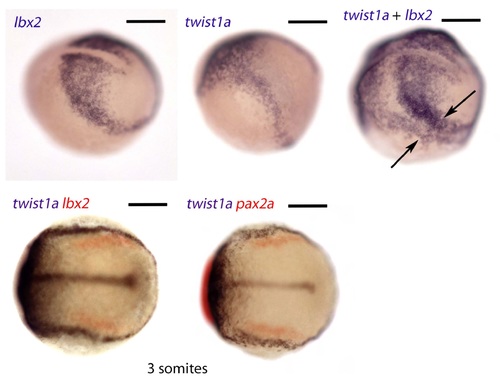
Expression patterns of twist1a, Ibx2, and pax2a. Upper panels show the expression patterns of twistla and Ibx2 at late gastrulation/early somitogenesis by single (left and middle panels) and double (right hand panel) whole mount in situ hybridisation. Arrows indicate the non-overlapping twistla+ and Ibx2+ domains corresponding to presumptive lateral plate mesoderm and intermediate mesoderm, respectively. Lower panels show two color double stainings at the 3 somite stage for twistla, Ibx2 and pax2a, as indicated. Scale bar represents 100 µm. |
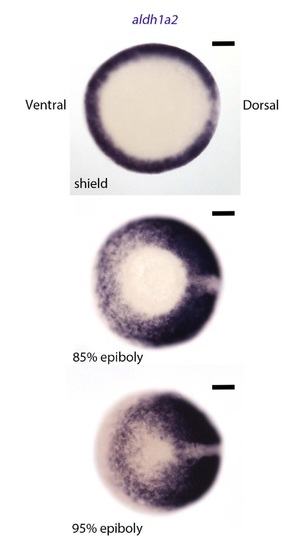
Gastrula stage series for aldh1a2 expression. Detection of aldh1a2 transcripts by whole mount in situ hybridization is shown at the shield, 85% epiboly and 95% epiboly stages. Embryos are viewed from the vegetal pole, with ventral to the left and dorsal to the right. Scale bar represents 200 µm. |
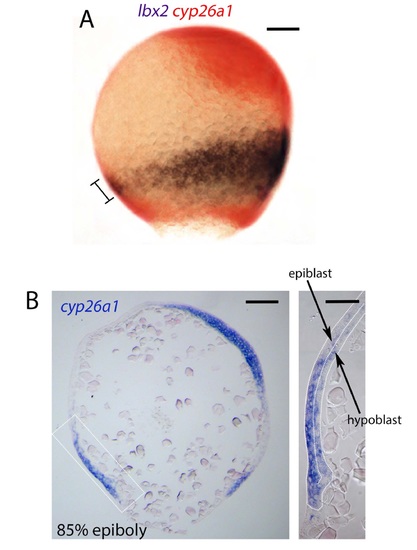
Expression of cyp26a1 and lbx2. A) Detection of Ibx2 (purple/black) and cyp26a1 (red) transcripts by whole mount in situ hybridization is shown at the 85% epiboly stage. The embryo is viewed laterally with the dorsal midline on the right. Bar indicates overlap between cyp26a1 and Ibx2 in the presumptive lower PLM domain. B) Cross section of an 85% epiboly embryo stained for cyp26a1 transcripts showing expression in the hypoblast and epiblast layers of the embryo. Scale bar in A) and low mag panel in B) represent 100 µm, scale bar in the inset high mag panel represents 50 µm |
Cross-sections of fate-mapped embryos double-stained for pax2a transcripts. Anterior and posterior nephron progenitors were lineage labeled in 85% epiboly embryos, examined by whole mount in situ hybridization at the 10 somite stage, and sectioned. Labeled cells contributing to the proximal and distal nephron were identified using an antibody to uncaged fluorescein (purple) and antisense probe for pax2a (red). Flat-mounted embryos are shown with anterior to the left, transverse sections are orientated with uncaged side to the right. Scale bars represent 200µm |
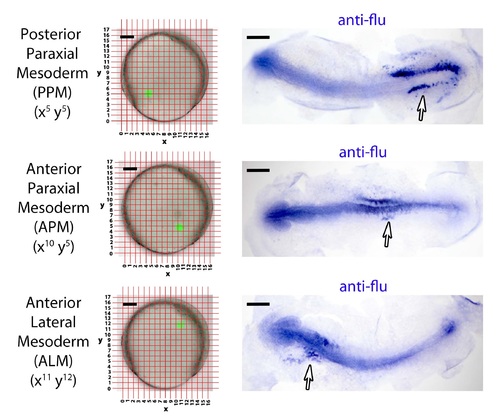
Fate-mapping of the PPM, APM and ALM domains at 85% epiboly stage. Embryos at the 85% epiboly stage were uncaged at various co-ordinates on the Cartesian grid as indicated (embryos are orientated with animal pole towards the top and dorsal side to the right). At the 10 somite stage, uncaged cells were detected by whole mount in situ hybridisation. Embryos are flat mounted with anterior to the left. Scale bars in left panels represent 100 µm and in right panels represent 200µm |
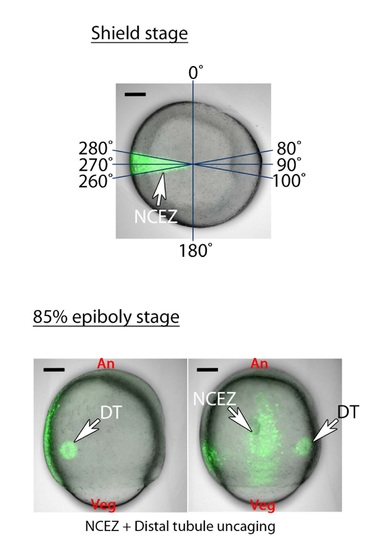
Distal tubule cells are positioned outside the non-convergence extension zone (NCEZ). To test if distal tubule (DT) progenitors are positioned within the NCEZ, we uncaged embryos injected with a caged fluorescein dextran lineage label at the shield stage (6 hpf) in a position that encompassed the ventral-most 20° (immediately opposing the organizer). These embryos were left to develop to the 85% epiboly stage and then DT progenitors were labeled by uncaging at position (x3, y7). We find these progenitors are not positioned within the NCEZ. Top panels are dorsal views, bottom left panel is a lateral and bottom right panel is a ventral midline view. Scale bars represent 100µm |
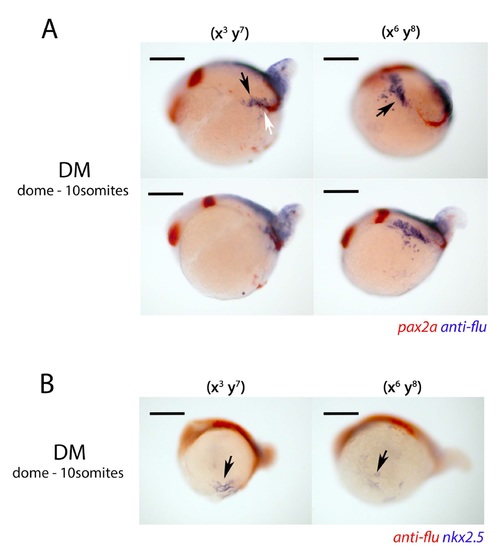
Oblique and lateral views of DM treated embryos lineage labeled at 85% epiboly at positions (x3 , y7) and (x6, y8). A) The same OM treated embryos shown in Figure 8B are shown here, with the top panels being oblique views and the bottom panels being lateral views. In the (x3 , y7) labeled embryos the lineage tracer can be detected within the anterior-most region of the pronephric pax2a+ domain (white arrow) as well as in a medial domain we presume to be paraxial mesoderm (black arrow). In the (x6 , y8) labeled embryos, oblique views highlight the more anterior region of tissue (black arrow), which we predict is anterior paraxial mesoderm, that has been traced in these OM treated embryos. B) The same OM treated embryos shown in Figure 8e are shown here, but in lateral views where nkx2.5+ heart progenitors can be better observed (black arrows). Scale bar represents 100 µm |