
- Title
-
Synaptic Ribbons Require Ribeye for Electron Density, Proper Synaptic Localization, and Recruitment of Calcium Channels
- Authors
- Lv, C., Stewart, W.J., Akanyeti, O., Frederick, C., Zhu, J., Santos-Sacchi, J., Sheets, L., Liao, J.C., Zenisek, D.
- Source
- Full text @ Cell Rep.
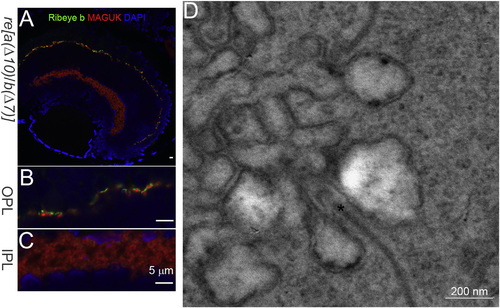
Ribeye and Synaptic Ribbons Remain in the Retina of ribeye a(Δ10)/ ribeye b(Δ7) (re[a(Δ10)/b(Δ7)]) double homozygous mutants. (A) Confocal image of Ribeye b (green) and post-synaptic maker MAGUK (red) staining in 5-dpf re[a(Δ10)/b(Δ7)] homozygous mutants. DAPI (blue) stains for the nucleus. Scale bar, 5 µm. (B) 3× magnification of outer plexiform layer staining in 5-dpf re[a(Δ10)/b(Δ7)] homozygous mutants retina. Scale bar, 5 µm. (C) 3× magnification of inner plexiform layer staining in 5-dpf re[a(Δ10)/b(Δ7)] homozygous mutants retina. Scale bar, 5 µm. (D) Electron micrograph of photoreceptor ribbon from 5-dpf re[a(Δ10)/b(Δ7)] homozygous mutant retina. Scale bar, 200 nm. |
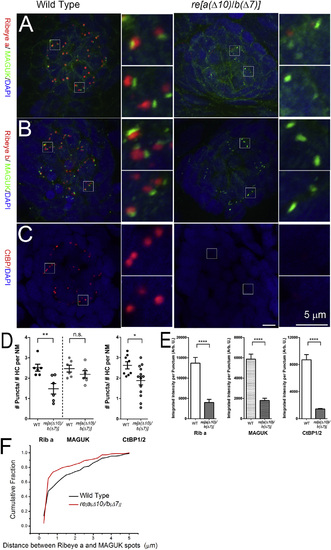
Ribeye Is Dramatically Reduced from Neuromast Hair Cells of re[a(Δ10)/b(Δ7)] Double Homozygous Mutants 5 dpf (A) Confocal images of Ribeye A (red) and post-synaptic density marker pan-MAGUK (green) staining 5 dpf in WT (left) and re[a(Δ10)/b(Δ7)] homozygous mutant (right) neuromast. Insets show magnified images centered around synapses. Note the close apposition of Ribeye a and pan-MAGUK in WT animals, whereas little Ribeye a staining is found near pan-MAGUK in the re[a(Δ10)/b(Δ7)] double-homozygous mutants. (B) Ribeye b (red) and pan-MAGUK (green) antibody staining in 5-dpf WT (left) and re[a(Δ10)/b(Δ7)] homozygous mutant (right) neuromast. (C) CtBP antibody staining (green) in 5-dpf WT (left) and re[a(Δ10)/b(Δ7)] homozygous mutant (right) neuromast. DAPI (blue) stains nucleus. Scale bars, 5 mm. (D) The number of Ribeye a, MAGUK, or CtBP1 immunolabeled puncta per hair cell in 5- to 6-dpf WT and re[a(Δ10/b(Δ7) mutants. Each circle represents an individual neuromast (NM) within a larva. The number of puncta per hair cell was approximated by dividing the number of Ribeye puncta within an NM by the number of hair cells in the NM. Error bars indicate SEM. Unpaired t test; **p = 0.0075; *p = 0.0226; n.s., not significant. (E) Integrated intensities per punctum of Ribeye a, MAGUK, and CtBP1. Bars represent the means; error bars indicate SEM. Mann-Whitney U test; ***p < 0.0001, for both mutant alleles. (F) Cumulative histogram of distances between Ribeye a spots to their nearest pan-MAGUK spot in confocal micrographs for WT (red) and re[a(Δ10/b(Δ7)] double-homozygous mutants (black). |
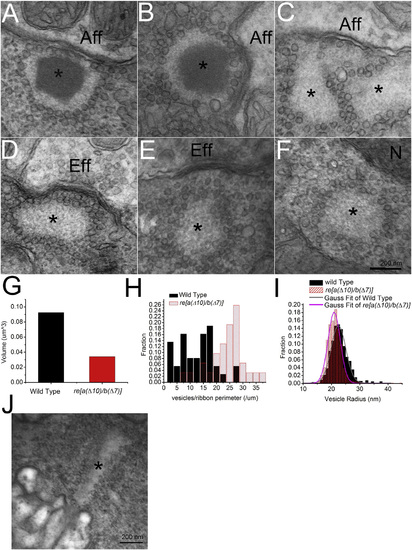
Mutant Zebrafish Exhibit Ribbons Lacking Synaptic Densities in Neuromast Hair Cells (A and B) Electron micrograph showing typical examples of synaptic ribbons in neuromast hair cells in 5- dpf WT zebrafish (marked by an asterisk). Note prominent density and typical localization near the afferent neuron (Aff). (C–F) Examples of electron micrographs of ghost ribbons (marked by an asterisk) taken from neuromast hair cells of re[a(Δ10)/b(Δ7)] homozygous zebrafish. Note the absence of a synaptic ribbon density with presence of vesicle array. Sone ghost ribbons locate near the afferent neurons (denoted Aff) (C), near the efferent neurons (Eff) (D), far away from the membrane (E), or in the middle of the cell (F). N denotes nucleus. Scale bar, 200 nm. (G) Volume of ribbon and ghost ribbons in 5-dpf WT and re[a(Δ10)/b(Δ7)] homozygous mutant hair cells. (H) Histogram of vesicle density per length of perimeter of ribbon or ghost ribbon in cross-section in WT and re[a(Δ10)/b(Δ7)] homozygous mutants. (I) Histogram of vesicle size associated with ribbon or ghost ribbon in WT and re[a(Δ10)/b(Δ7)] homozygous mutants. (J) Electron micrograph of ghost-ribbon like structure in the outer plexiform layer of re[a(Δ10)/b(Δ7)] double homozygous retina. |
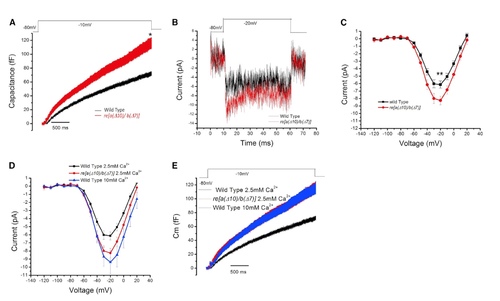
Results from Whole-Cell Voltage-Clamp Recordings from WT and re[a(Δ10)/b(Δ7)] Homozygous Mutant Neuromast Hair Cells (A) Average whole-cell capacitance measurements of WT (black, n = 11) and re[a(Δ10)/b(Δ7)] homozygous mutants (red, n = 12) neuromast hair cells in response to 3-s step-depolarizations. Note that all traces include error bars denoting SEM for each condition. The average capacitance increase at the end of the 3-s depolarization (averaged over 100 ms) was 67.8 ± 5.0 fF for the WT hair cells and was 106.1 ± 13.6 fF in the mutants. p = 0.018. (B) Averaged calcium current trace of WT (black) and re[a(Δ10)/b(Δ7)] homozygous (red) mutants in response to a 20-mV step depolarization. (C) Plot of current-voltage relationship for WT fish NM hair cells (black, n = 15) and re[a(Δ10)/b(Δ7)] homozygous mutant neuromast hair cells (red, n = 17). At 20 mV, the average current in WT cells was 6.1 ± 0.5 pA, and mutant fish cells was 8.3 ± 0.6 pA. p = 0.010. The fish recorded were between 5 and 8 days old, and the neuromasts recorded were P3 and P4. (D) Capacitance recording of WT fish at 2.8 mM Ca2+ (black) and 10 mM Ca2+ (blue) external solution and double-mutant fish at 2.8 mM Ca2+ external solution (red) in response to a 3-s step depolarization. The average capacitance increase at the end of the 3-s depolarization (averaged over 100 ms) was 105.09 ± 13.74 fF for the WT hair cells at 10 mM Ca2+ solution. Capacitance increases in WT and double-mutant fish in 2.8 Ca2+ external solution are the same as in (A). (E) Plot of current-voltage relationship of WT fish at 2.8 mM Ca2+ (black) and 10 mM Ca2+ (blue) external solution, and double-mutant fish at 2.8 mM Ca2+ external solution (red). At 20 mV, the calcium current of WT fish in 10 mM Ca2+ external solution is 9.39 ± 1.40 pA, compared to double-mutant fish in 2.8 mM Ca2+ external solution is 8.26 ± 0.58 pA. |
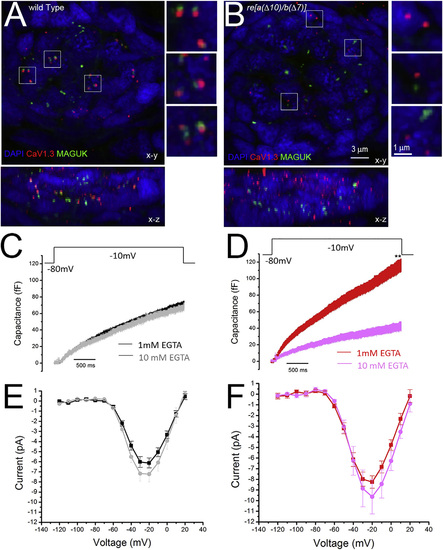
re[a(Δ10)/b(Δ7)] Homozygous Hair Cells Have Poorly Localized Calcium Channels and Exhibit Enhanced Sensitivity to 10 mM EGTA (A and B) Immunolabel of CaV1.3a and MAGUK in 5-dpf WT (A) and re[a(Δ10)/b(Δ7)] (B). While Cav1.3 immunolabeled puncta generally localize to the presynapse adjacent to postsynaptic MAGUK immunolabel in WT (A; insets), CaV1.3a clusters fail to localize to the presynapse in re[a(Δ10/b(Δ7)] mutants (B; inset). (C and D) Capacitance increase of WT and double-mutant neuromast hair cells in response to a 3-s step depolarization with 1 mM EGTA or 10 mM EGTA (gray, n = 8) in the internal solution. The average capacitance increase at the end of the 3-s depolarization (averaged over 100 ms) of WT fish was 67.8 ± 5.0 fF at 1 mM EGTA (C; black, n = 11) and 62.8 ± 4.9 fF at 10 mM EGTA (C; gray, n = 7); p = 0.50. 10 mM EGTA blocks 7.4% of release, compared to 1 mM EGTA in WT fish. The average capacitance increase at the end of the 3-s depolarization (averaged over 100 ms) of double mutants was 106.1 ± 13.6 fF at 1 mM EGTA (D; red, n = 12), and 36.3 ± 8.7 fF at10 mM EGTA (D; pink, n = 8), p = 0.01. 10 mM EGTA blocks 66.% of release compared to 1 mM EGTA. (E and F), Plot of current-voltage relationship for WT fish NM hair cells (E) and re [a(Δ10)/b(Δ7)] homozygous mutant neuromast hair cells (F) at 1 mM EGTA and 10 mM EGTA internal solution. At 20 mV, the average current of WT cells was 6.1 ± 0.5 pA at 1 mM EGTA (E; red, n = 15) and 6.9 ± 0.9 (E; pink, n = 8). p = 0.46. The average current of mutant fish cells was 8.26 ± 0.58 pA at 1 mM EGTA solution (F; red, n = 17), and 9.9 ± 2.2 pA at 10 mM EGTA solution (F; pink, n = 6). p = 0.49. The fish recorded were between 5 and 8 days old, and the neuromasts recorded were P3 and P4. |
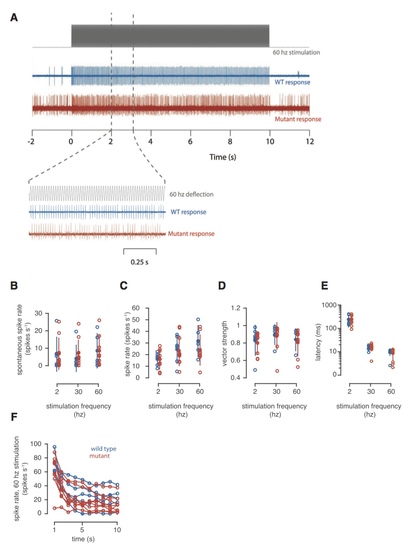
Electrophysiology Recordings from the Primary Afferent Neurons of Lateral Line Neuromasts (A) Representative traces showing the spiking rates for the afferent neurons of WT (blue) and mutant (red) zebrafish in response to 10 s of 60-Hz sine wave stimulation. (B) The spontaneous spike rate measured for WT and mutant animals before stimulation. (C) The average spike rate calculated over the entire 10 s of stimulation for stimulation frequencies of 2, 30, and 60 Hz. (D) The average vector strength calculated for the entire 10 s of stimulation. (E) The latency between the onset of stimulation and the first spike. (F) The spike rate as a function of time during 10 s of 60 Hz stimulation. Closed circles show the mean; error bars indicate SD.
|
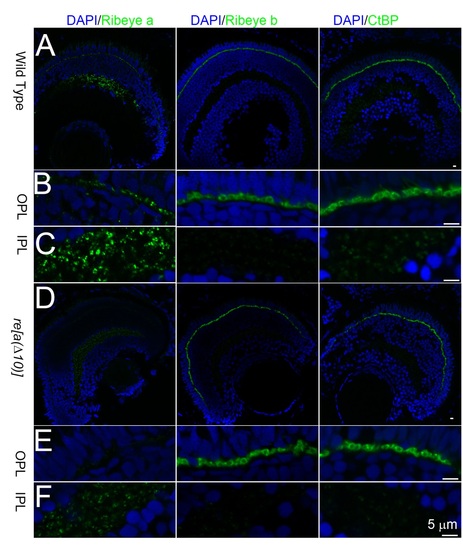
Expression of Ribeye A, Ribeye B nor CtBP in 5dpf wt and ribeye a Δ10 retina. A, Confocal images of Ribeye A, Ribeye B, and CtBP staining (green) in 5dpf wt zebrafish retina. B, 3X magnification of outer plexiform layer staining in wt 5dpf zebrafish retina. C, 3X magnification of inner plexiform layer staining in wt 5dpf zebrafish retina. D, Confocal images of Ribeye A, Ribeye B, and CtBP staining (green) in 5dpf ribeye a Δ10 mutant fish retina. E, 3X amplification of outer plexiform layer staining in 5dpf ribeye a Δ10 mutant fish retina. Notice the dramatic reduction of Ribeye A staining in ribeye a Δ10 mutant fish. F, 3X magnification of inner plexiform layer staining in 5dpf ribeye a Δ10 mutant fish retina. DAPI (blue) stains nucleus. WT and mutant fish were taken under the same settings for the same antibody. Scale bar is 5 µm. |