
- Title
-
Alk1 controls arterial endothelial cell migration in lumenized vessels
- Authors
- Rochon, E.R., Menon, P.G., Roman, B.L.
- Source
- Full text @ Development
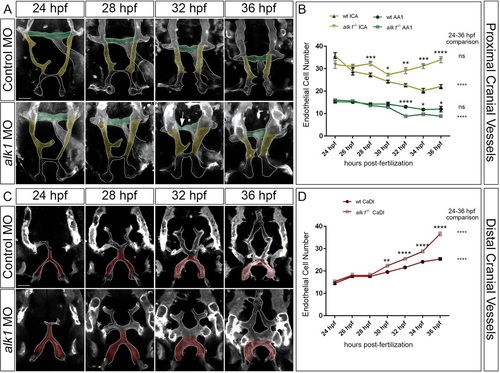
Arterial endothelial cell numbers are altered in alk1-deficient embryos in a segment-specific manner. (A,C) 2D maximum projections of selected time points from confocal time-lapse imaging of Tg(fli1a.ep:mRFP-CAAX)pt505 control and alk1-morphant embryos, 24-36hpf, showing proximal cranial vessels/ventral planes (A) and distal cranial vessels/dorsal planes (C) of a single embryo. Dorsofrontal views, anterior down. Shaded regions correspond to vessel segments analyzed for cell number in B,D: green, AA1; yellow, proximal ICA; red, CaDI. Arrow in A points to transient AA1 stenosis. Scale bars: 50µm. (B,D) Endothelial cell counts in AA1 and ICA (B) and CaDI (D) in precisely staged alk1-/- embryos and wild-type (wt) siblings. Data are mean±s.e.m., ne4 embryos for each data point. Data were analyzed by two-way ANOVA followed by Bonferroni′s multiple comparisons test. Wild type and alk1-/- comparisons: significance indicated above time point. Within-treatment temporal comparisons: significance indicated to right of graph. ns, not significant, *P<0.05, **P<0.01, ***P<0.001, ****P<0.0001. EXPRESSION / LABELING:
PHENOTYPE:
|
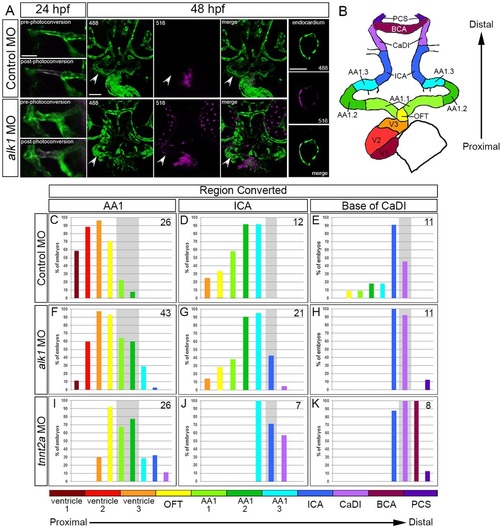
Arterial endothelial cell displacement towards the heart requires alk1 and blood flow. (A) Representative two-dimensional confocal projections of control and alk1-morphant Tg(fli1a:GAL4FF)ubs4;Tg(UAS:kaede)rk8 embryos at 24hpf (pre- and post-photoconversion of AA1 with 405nm laser) and 48hpf. Green, native Kaede; magenta, photoconverted Kaede. Arrowheads denote segment originally photoconverted. 24hpf: merge; dorsal view, anterior down. 48hpf: 488nm laser (native Kaede; green), 516nm laser (photoconverted Kaede; magenta), and merge; frontal view, dorsal up. Trio of images at right shows a single plane of a wild-type ventricle at 48hpf, demonstrating the contribution of AA1-derived cells to the endocardium. Scale bars: 50µm. (B) Schematic of 48hpf heart and cranial vasculature showing color-coded segmental boundaries used for analysis of location of photoconverted cells. (C-K) Percentage of 48hpf control (C-E), alk1-morphant (F-H) and tnnt2a-morphant (I-K) embryos exhibiting photoconverted cells in specified region of heart and cranial vessels; data are laid out proximal (left) to distal (right) with respect to the heart. Cells were photoconverted at 24hpf in proximal AA1 (C,F,I), proximal ICA (D,G,J) or at the CaDI/ICA junction (E,H,K). Gray shading denotes site of photoconversion. n (number of embryos) noted in each panel, upper right. EXPRESSION / LABELING:
PHENOTYPE:
|
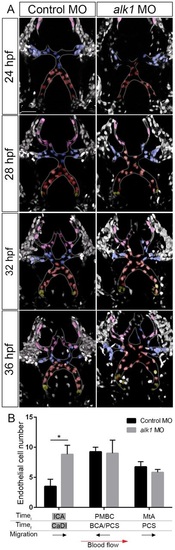
Endothelial cell migration in the direction of blood flow is enhanced in the CaDI in alk1-deficient embryos. (A) 2D maximum projections of selected time points from two-photon time-lapse imaging of distal cranial blood vessels in control and alk1-morphant Tg(fli1a:nEGFP)y7 embryos, ~24-36hpf. See also Movies 3,4. Vessels of interest are outlined to improve clarity. Selected nuclei are color coded according to their position at the beginning of the time series. Red, cells originate in CaDI; blue, cells originate from PMBC; pink, cells originate from MtA; yellow, cells originate from ICA. Dorsal views, anterior down. Scale bar: 50µm. (B) Quantification of endothelial cells grouped by initial (Timei, 24hpf) and final (Timef, 36hpf) positions. n=4 control, 6 alk1 morphants. Below the graph, names of alk1-positive vessels are shaded gray, and direction of cell migration with respect to blood flow is depicted by black arrows. Graphs represent mean±s.e.m. Two-tailed Student′s t-test, *P<0.05. |
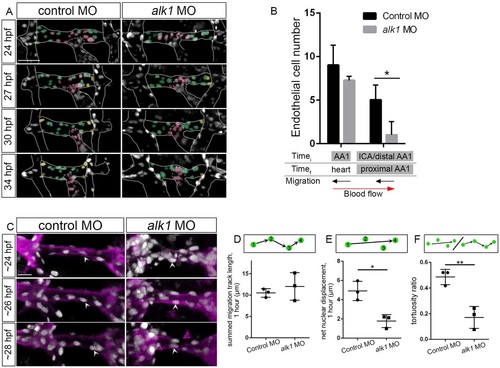
Endothelial cell migration against blood flow is impaired in AA1 in alk1-deficient embryos. (A) 2D maximum projections of selected time points from time-lapse two-photon imaging of proximal cranial vessels in control and alk1-morphant Tg(fli1a:nEGFP)y7 embryos, ~24-34hpf. Vessels of interest are outlined to improve clarity. AA1 nuclei are color coded according to their behavior over the course of the movie. Green, cells remain in proximal AA1; pink, cells move from AA1 into the OFT/heart; yellow, cells enter proximal AA1 from more distal segments. Scale bar: 50 µm. (B) Quantification of endothelial cells grouped by initial (Timei, 24hpf) and final (Timef, 34hpf) positions. n=3 controls, 4 alk1 morphants. Below the graph, names of alk1-positive vessels are shaded gray, and direction of cell migration with respect to blood flow is depicted by black arrows. (C) 2D maximum projections of selected time points from time-lapse confocal/two-photon imaging of the right side of AA1 in Tg(fli1a:nEGFP)y7;Tg(fli1a.ep:mRFP-CAAX)pt505 control and alk1-morphant embryos. See also Movies 1,2. Endothelial cell membranes, magenta; endothelial cell nuclei, gray. White arrowheads track a single cell nucleus over time in each embryo. Dorsal views, anterior down. Scale bar: 20µm. (D-F) From these movies, we quantified summed migration track length (D), net nuclear displacement (E) and tortuosity ratio (F). Each data point represents mean values for a single embryo, 6-10 cells per embryo. Only cells that could be tracked for a minimum of four consecutive frames were included in the analysis. Graphs represent mean±s.e.m. for n=3 controls and 3 alk1 morphants. Two-tailed Student′s t-test, *P<0.05, **P<0.01. |
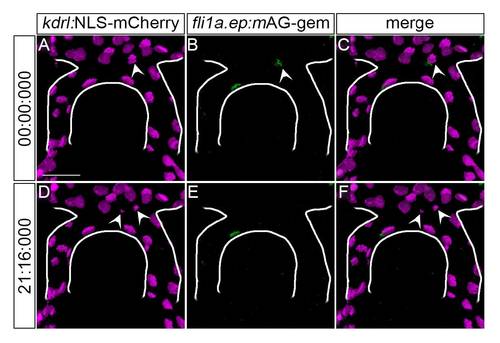
Tg(fli1a.ep:mAG-geminin)pt525 marks proliferating endothelial cells. 2D maximum projections of t = 0, ~36 hpf (A-C) and t = 21 min 16 sec (D-F) from confocal/two-photon timelapse imaging of a Tg(kdrl:NLS-mCherry)is4; Tg(fli1a.ep:mAG-geminin)pt525 embryo. Endothelial cell nuclei, magenta; endothelial S/G2/M-phase nuclei, green. Arrowheads, dividing cell (A-C) and progeny (D-F) transiently marked by mAG-geminin. The caudal division of the internal carotid artery (CaDI) is outlined in white. Frontal view, anterior up. Scale bar, 50 µm. Representative of N = 3 independent embryos. |
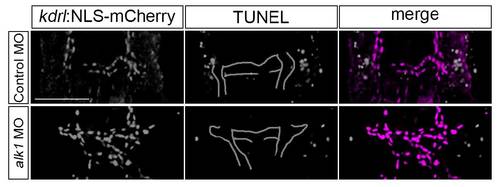
Apoptosis does not contribute to changes in arterial endothelial cell number in alk1-deficient embryos. 2D confocal projections of 50 µm vibratome sections of 30 hpf control- (N = 8) and alk1-morphant (N = 9) Tg(kdrl:NLS-mCherry)is4 embryos, stained for apoptotic cells via TUNEL. Aortic arch 1 (AA1) and internal carotid artery (ICA) are traced for clarity. No apoptotic cells were detected in AA1, ICA or CaDI. Dorsal view, anterior down. Scale bar, 50 µm. |