
- Title
-
Remote z-scanning with a macroscopic voice coil motor for fast 3D multiphoton laser scanning microscopy
- Authors
- Rupprecht, P., Prendergast, A., Wyart, C., Friedrich, R.W.
- Source
- Full text @ Biomed. Opt. Express
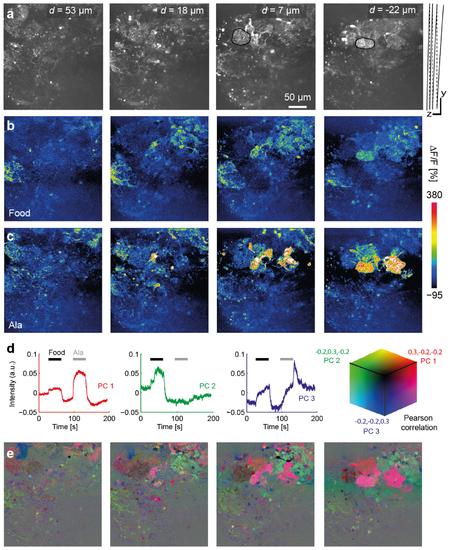
Calcium imaging in the olfactory bulb using configuration 1. (a) Calcium indicator fluorescence (512 x 512 pixels) in four optical sections through the OB of an adult Tg(NeuroD:GcaMP6F)icm05 fish (see Visualization 1). Values of d show the displacement of the center of each image from the reference plane (no mirror displacement; D = 0 and d = 0). Raw fluorescence images were averaged over the full 200 s. Two glomerular structures are outlined in black. Right: scan trajectory in yz; both scalebars are 50 µm. (b,c) Relative change in fluorescence intensity during application of each odor (40 s). (d) Time courses of first three principal components (PC 1-3) (e) Correlation maps showing the correlation coefficient between the time course of each pixel and each PC. For each optical section, the correlation maps for each PC are combined into a single RGB image (see color cube). EXPRESSION / LABELING:
|
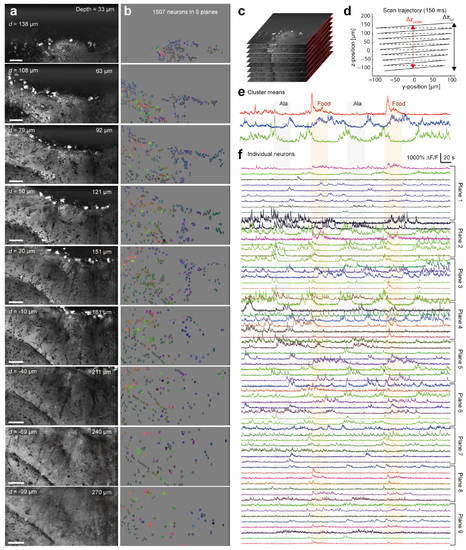
Calcium imaging in Dp using configuration 2. (a) Fluorescence in each plane, averaged over the full duration of 400 s (see Visualization 2). d indicates the focal shift d(D), ‘depth’ the axial distance of the plane from the brain surface. All scale bars are 50 µp;m. (b) ROIs depicting clearly identified somata of 1507 neurons. Colors encode the correlation between the fluorescence time courses of each ROI and the first three clusters (e) in RGB (see Fig. 5(e)). (c) Schematic depiction of scanned planes. (d) Scan trajectory in yz. Planes were tilted (angle, 9.5°) and lower planes were slightly smaller due to FOV compression. Dashed lines indicate flybacks of the y-scanner. (e) Time courses of fluorescence signals averaged over ROIs of the first three activity clusters. Color corresponds to the RGB code in (b) and (f). Shading depicts periods of odor application. (f) Fluorescence time courses of subsets of ROIs from each plane. RGB color code shows correlation to the time course of each cluster (e). |