
- Title
-
Synergy between loss of NF1 and overexpression of MYCN in neuroblastoma is mediated by the GAP-related domain
- Authors
- He, S., Mansour, M.R., Zimmerman, M.W., Ki, D.H., Layden, H.M., Akahane, K., Gjini, E., de Groh, E.D., Perez-Atayde, A.R., Zhu, S., Epstein, J.A., Look, A.T.
- Source
- Full text @ Elife
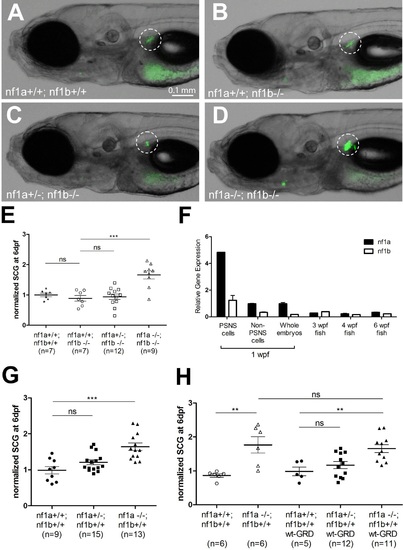
The GRD domain of NF1 cannot rescue the PSNS overgrowth in nf1 deficient zebrafish. (A-D) Development of superior cervical ganglia (SCG, highlighted by dotted circles) in representative embryos of nf1a+/+;nf1b+/+;GFP, nf1a+/+;nf1b-/-;GFP, nf1a+/-;nf1b-/-;GFP and nf1a-/-;nf1b-/-;GFP genotypes at the age of 6 days postfertilization (dpf). (E) Quantification of GFP+ cells in the SCG of embryos of nf1a+/+;nf1b+/+;GFP (n = 7), nf1a+/+;nf1b-/-;GFP (n = 7), nf1a+/-;nf1b-/-;GFP (n = 12) and nf1a-/-;nf1b-/-;GFP (n = 9) genotypes at the age of 6 dpf. (F) Quantitative RT-PCR showing the relative expression levels of nf1a and nf1b in the PSNS of zebrafish embryos and juveniles. 1-week-old dbh:mCherry embryos (n = 200) were pooled, dissociated and FACS sorted to obtain PSNS (mCherry+) and non-PSNS (mCherry-) cells for analysis. RNA of whole embryos from the same clutch of eggs were also analyzed. RNAs from whole juvenile zebrafish at the ages of 3, 4, and 6 weeks were also examined by quantitative RT-PCR. (G) Quantification of GFP+ cells in the SCG of embryos of nf1a+/+;nf1b+/+;GFP (n = 9), nf1a+/-;nf1b+/+;GFP (n = 15) and nf1a-/-;nf1b+/+;GFP (n = 13) genotypes at the age of 6 dpf. (H) Quantification of GFP+ cells in the SCG of embryos of nf1a+/+;nf1b+/+;GFP (n = 6), nf1a-/-;nf1b+/+;GFP (n = 6), nf1a+/+;nf1b+/+;GFP;wt-GRD;mCherry (n = 5), nf1a+/-;nf1b+/+;GFP;wt-GRD;mCherry (n = 12) and nf1a-/-;nf1b+/+;GFP;wt-GRD;mCherry (n = 11) genotypes at the age of 6 dpf. **p<0.01, ***p<0.001 by two-tailed unpaired t-test. EXPRESSION / LABELING:
PHENOTYPE:
|
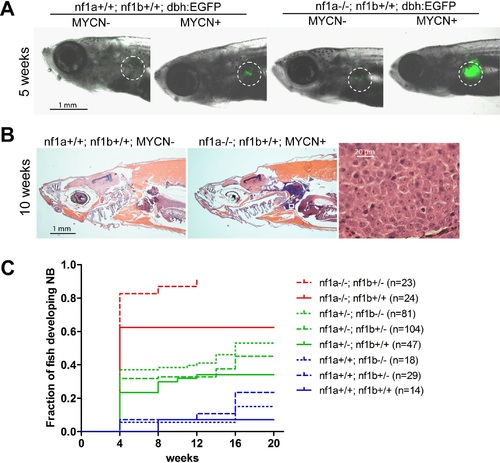
Loss of nf1 accelerates disease onset and increases the penetrance of MYCN-induced neuroblastoma. (A) Representative fish of nf1a+/+;nf1b+/+;GFP, nf1a+/+;nf1b+/+;MYCN;GFP, nf1a-/-;nf1b+/+;GFP and nf1a-/-;nf1b+/+;MYCN;GFP genotypes at 5 weeks of age.The interrenal glands (IRGs) are highlighted with dashed circles. (B) H&E-stained sagittal sections of a 10-week old nf1a+/+;nf1b+/+;GFP fish (left) and a 10-week old nf1a-/-;nf1b+/-;GFP;MYCN fish (middle) and 63-fold magnified tumor cells (right), which are magnified from the area in the small white box in the middle panel. (C) Cumulative frequency of neuroblastoma in MYCN transgenic zebrafish representing all eight nf1 genotypes generated by the breeding of the nf1a+/-;nf1b+/-;MYCN line with the nf1a+/-;nf1b+/- zebrafish line (*p<0.0001 nf1a-/-;nf1b+/+ vs. nf1a+/+;nf1b+/+). EXPRESSION / LABELING:
PHENOTYPE:
|
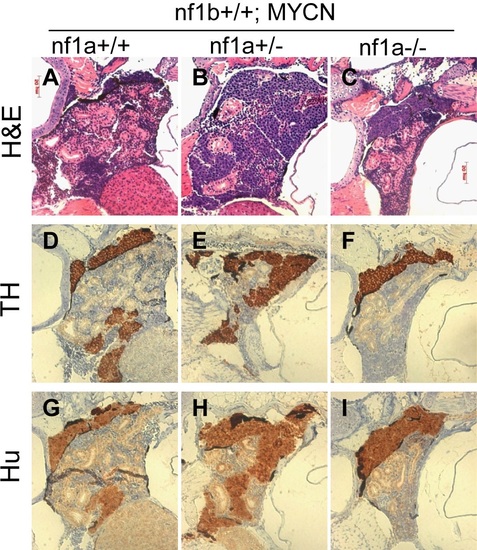
Neuroblastomas arise from sympathetic neuroblast precursors in MYCN transgenic fish with loss of nf1. H&E staining of sagittal sections through the tumors in the IRG of nf1a+/+;nf1b+/+;MYCN;GFP (A), nf1a+/-;nf1b+/+;MYCN;GFP (B) and nf1a-/-;nf1b+/+;MYCN;GFP (C) fish at the age of 6 weeks. Immunohistochemical analysis of neuroblastoma markers tyrosine hydroxylase (TH, D-F) and Hu (G-I) expression on sagittal sections through tumors in the IRG of nf1a+/+;nf1b+/+;MYCN;GFP (D,G), nf1a+/-;nf1b+/+;MYCN;GFP (E,H) and nf1a-/-;nf1b+/+;MYCN;GFP (F,I) fish at the age of 6 weeks. EXPRESSION / LABELING:
|
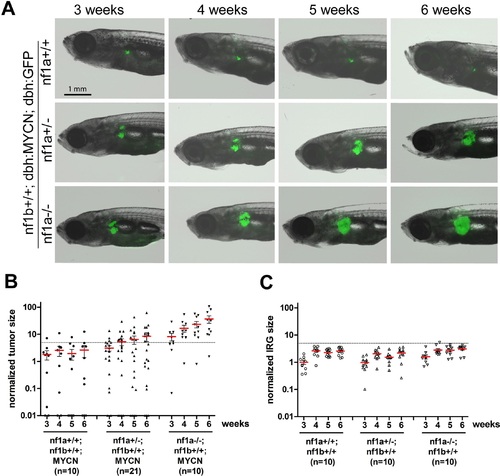
Loss of nf1 promotes neuroblastoma tumor progression in MYCN transgenic fish. (A) Neuroblastoma development in representative fish of the nf1a+/+;nf1b+/+;MYCN;GFP, nf1a+/-;nf1b+/+;MYCN;GFP and nf1a-/-;nf1b+/+;MYCN;GFP genotypes over 3 to 6 weeks of age.Each fish was imaged weekly for 3 continuous weeks from 3 weeks of age. (B) Quantification of GFP+ sympathoadrenal cells in the IRG of fish with nf1a+/+;nf1b+/+;MYCN;GFP (n = 10), nf1a+/-;nf1b+/+;MYCN;GFP (n = 21) and nf1a-/-;nf1b+/+;MYCN;GFP (n = 15) genotypes, demonstrating tumor progression over 3 weeks. Tumors were scored when the GFP+ signals in the IRG exceeded the threshold defined by the dotted line. (C) IRG development in nf1a mutant zebrafish lacking overexpression of MYCN. Quantification of GFP+ sympathoadrenal cells in the IRG of fish with nf1a+/+;nf1b+/+;GFP (n = 10), nf1a+/-;nf1b+/+;GFP (n = 10) and nf1a-/-;nf1b+/+;GFP (n = 10) genotypes. The same tumor threshold line shown in panel B is included for comparison. EXPRESSION / LABELING:
PHENOTYPE:
|
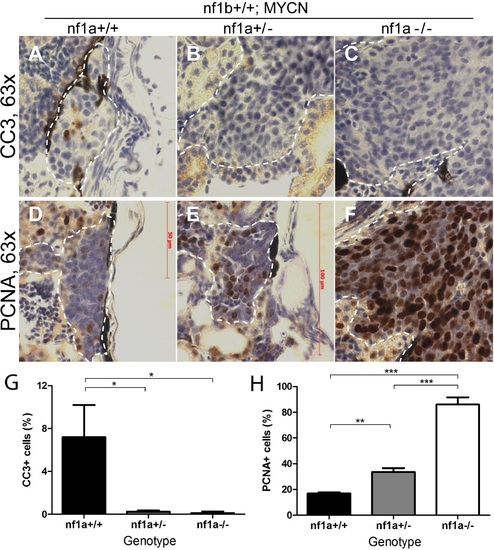
Loss of nf1 suppresses apoptosis and enhances proliferation of tumor cells in MYCN-driven neuroblastoma. Immunohistochemical analysis of sagittal sections through tumors in the IRG of nf1a+/+;nf1b+/+;MYCN;GFP (A,D), nf1a+/-;nf1b+/+;MYCN;GFP (B,E) and nf1a-/-;nf1b+/+;MYCN;GFP (C,F) fish at the age of 6 weeks, using antibodies against cleaved caspase-3 (CC3; A-C) and proliferating cell nuclear antigen (PCNA; D-F).Dotted lines indicate tumor boundaries. Quantification of CC3-positive (G) and PCNA-positive (H) cells. Values are means + s.e.m. per section (three nf1a+/+;nf1b+/+;MYCN;GFP, five nf1a+/-;nf1b+/+;MYCN;GFP and four nf1a-/-;nf1b+/+;MYCN;GFP tumors). *p<0.05, **p<0.01, ***p<0.001 by two-tailed unpaired t-test. EXPRESSION / LABELING:
PHENOTYPE:
|
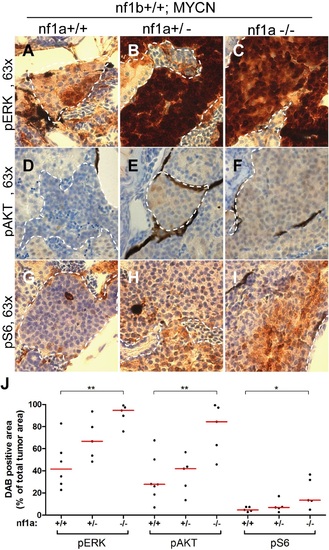
Loss of nf1 results in aberrant ERK/Akt/mTOR signaling in MYCN-driven neuroblastoma. Immunohistochemical analysis of sagittal sections through tumors in the IRG of nf1a+/+;nf1b+/+;MYCN;GFP (A,D,G), nf1a+/-;nf1b+/+;MYCN;GFP (B,E,H) and nf1a-/-;nf1b+/+;MYCN;GFP (C,F,I) fish at the age of 6 weeks, using antibodies against phosphorylated ERK1/2 (pERK, A-C), phosphorylated AKT (pAKT, D-E) and phosphorylated S6 (pS6, G- I). Dotted lines indicate the tumor boundaries. The quantification of pERK-, pAKT- and pS6-positive tumor areas are shown in (J), with the red bars representing the median values. ns p>0.05, *p<0.05, **p<0.01 by two-tailed unpaired t-test. EXPRESSION / LABELING:
PHENOTYPE:
|
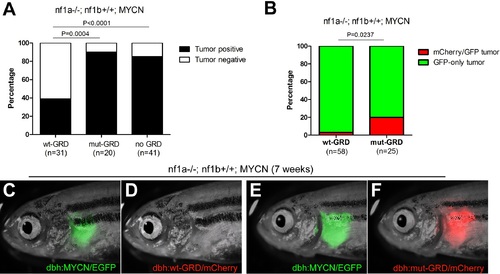
GRD domain is required for the tumor suppressor function of nf1 in MYCN-driven neuroblastoma tumorigenesis. (A) Tumor penetrance of stable transgenic zebrafish with the genotypes of nf1a-/-;nf1b+/+;GFP;wt-GRD;mCherry (n = 31), nf1a-/-;nf1b+/+;GFP;mut-GRD;mCherry (n = 20) and nf1a-/-;nf1b+/+;GFP;mCherry (n = 41) at the age of 12 weeks. (B) nf1a-/-;nf1b+/+;MYCN;GFP fish injected with dbh:wt-GRD;dbh:mCherry (n = 58) showed a significantly lower mCherry+ mosaic tumor rate compared with the sibling fish injected with dbh:mut-GRD;dbh:mCherry (n = 25) at the age of 7 weeks (Fisher’s exact test), indicating the tumor suppression function of the NF1 GRD domain.Most early tumors arose in nf1a-/-;nf1b+/+;MYCN;GFP fish injected with dbh:wt-GRD; dbh:mCherry only expressed GFP (C) but not mCherry fluorescent protein (D). A significant subset of early tumors arose in nf1a-/-;nf1b+/+;MYCN;GFP fish injected with dbh:mut-GRD; dbh:mCherry did express both GFP (E) and mCherry (F). PHENOTYPE:
|
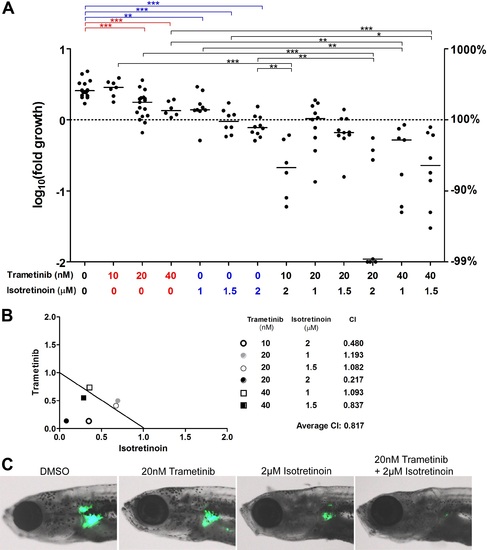
The MEK inhibitor trametinib synergizes with isotretinoin in suppressing nf1-deficient neuroblastoma in vivo. (A) Neuroblastoma growth in nf1a-/-;nf1b+/+;MYCN;GFP fish treated with vehicle control, trametinib, isotretnoin or combinations of trametinib and isotretnoin. Representative fish are shown in (C). (B) Synergistic effects of trametinib and isotretinoin on tumor suppression were analyzed by isobologram analysis. EXPRESSION / LABELING:
PHENOTYPE:
|
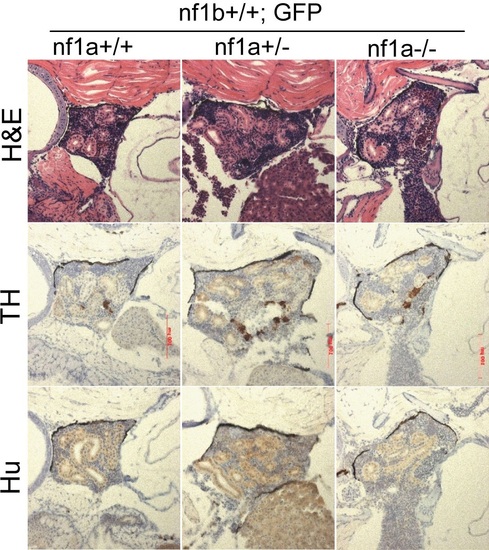
No TH+, Hu+ neuroblasts was detected in the IRG of nf1a mutant zebrafish which had no overexpression of MYCN. H&E staining and immunohistochemical analysis of TH and Hu expression on sagittal sections through the IRG of nf1a+/+;nf1b+/+;GFP, nf1a+/-;nf1b+/+;GFP and nf1a-/-;nf1b+/+;GFP fish at the age of 6 weeks. |
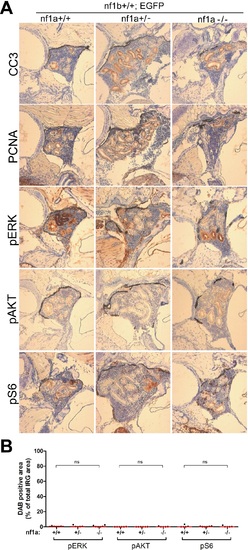
No aberrant ERK/AKT/mTOR signaling was detected in the IRG of nf1a mutant fish that lacked MYCN overexpression. (A) Immunohistochemical analysis of sagittal sections through the IRG of nf1a+/+;nf1b+/+;GFP, nf1a+/-;nf1b+/+;GFP and nf1a-/-;nf1b+/+;GFP fish at the age of 6 weeks, using antibodies against phosphorylated ERK1/2 (pERK), phosphorylated AKT (pAKT), phosphorylated S6 (pS6), cleaved Caspase-3 (CC3) and proliferating cell nuclear antigen (PCNA). The quantification of pERK-, pAKT- and pS6-positive IRG areas are shown in (B), with the red bars representing the median values. ns p>0.05, *p<0.05, **p<0.01 by two-tailed unpaired t-test. |
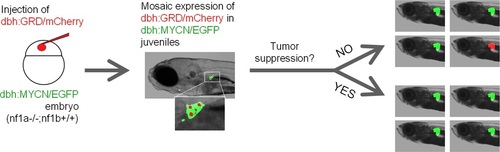
Scheme of the mosaic structure-function analysis using NF1-GRD. An equal mixture of dbh:mCherry and dbh:GRD was injected into the nf1a-/-;nf1b+/+;MYCN;GFP embryos at the one-cell stage. The injected transgenes randomly integrated into different cells and resulted in the mosaic expression of mCherry/GRD in their PSNS. A subpopulation of early tumors is expected to be mCherry+, GFP+ if the tumorigenesis capacity of the mCherry+ PSNS cells is not suppressed. When the tumor suppression function of nf1 is restored, the mCherry+ PSNS cells are not capable of progress into early neuroblastoma tumor and all early tumors are expected to be mCherry-, GFP+. |