
- Title
-
Stress from Nucleotide Depletion Activates the Transcriptional Regulator HEXIM1 to Suppress Melanoma
- Authors
- Tan, J.L., Fogley, R.D., Flynn, R.A., Ablain, J., Yang, S., Saint-André, V., Fan, Z.P., Do, B.T., Laga, A.C., Fujinaga, K., Santoriello, C., Greer, C.B., Kim, Y.J., Clohessy, J.G., Bothmer, A., Pandell, N., Avagyan, S., Brogie, J.E., van Rooijen, E., Hagedorn, E.J., Shyh-Chang, N., White, R.M., Price, D.H., Pandolfi, P.P., Peterlin, B.M., Zhou, Y., Kim, T.H., Asara, J.M., Chang, H.Y., Young, R.A., Zon, L.I.
- Source
- Full text @ Mol. Cell
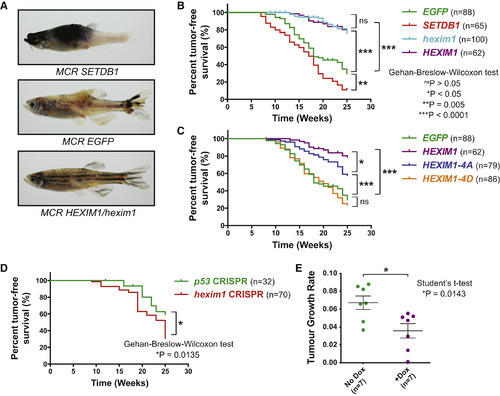
HEXIM1 Activity Suppresses Melanoma In Vivo (A) 19-week-old Tg(mitfa:BRAFV600E);p53-/-;mitfa-/- zebrafish are shown with rescued melanocytes expressing tumor accelerator SETDB1, background control EGFP, or HEXIM1/hexim1 in the MiniCoopR system. (B) Tumor-free survival curves for EGFP, SETDB1, and HEXIM1/hexim1 MiniCoopR zebrafish over 25 weeks. Percentages of the total number of zebrafish that were tumor free each week are plotted. (C) Tumor-free survival curves for MiniCoopR overexpression of human HEXIM1-4A, and HEXIM1-4D are shown. (D) Tumor-free survival curves for MiniCoopR expression of p53 and hexim CRISPRs are shown. (E) Tumor growth rates of individual mouse xenografts with a Tet-On HEXIM1-inducible A375 cell line (A375-HEXIM1) over 14 days. Mice were fed either a standard diet or doxycycline diet (mean of seven replicates ± SD). See also Figure S2. PHENOTYPE:
|
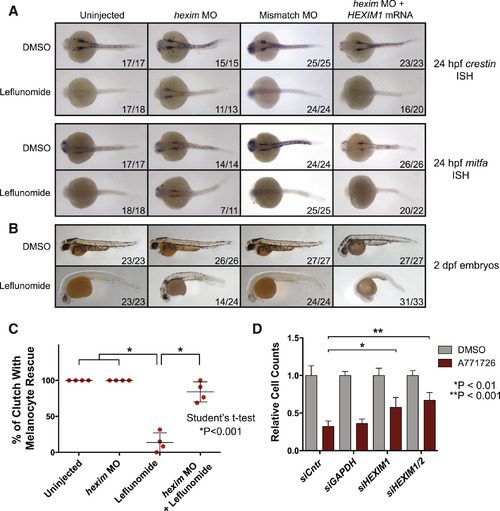
Knockdown of HEXIM1 Rescues Nucleotide Stress-Associated Neural Crest Ablation and Melanoma Suppression Phenotypes (A) Zebrafish embryos were injected with 8 ng hexim1 or control morpholino (MO) or a combination of hexim1 MO and 300 pg human HEXIM1 mRNA. Embryos were treated with DMSO or 6.5 µM lef at 50% epiboly and in situ hybridization was performed at 24 hr post-fertilization (hpf) for crestin or mitfa expression. Dorsal views of embryos are shown. Numbers indicate the number of embryos with the shown phenotype versus the total number of embryos in the clutch. (B) Embryos treated as in (A) were scored for melanocytes at 2 dpf. (C) Four clutches of embryos were analyzed for rescue of melanocytes under the conditions of uninjected, hexim1 MO injected, lef treatment, or hexim1 MO injected with lef treatment. Percentages of the number of embryos rescued in each clutch are plotted (mean ± SD). (D) Cell number of A375 cells treated with 25 µM A771726 in combination with siRNA pools for GAPDH, HEXIM1, and HEXIM2 relative to DMSO controls is shown (mean of three replicates ± SD). See also Figure S3. |

ZFIN is incorporating published figure images and captions as part of an ongoing project. Figures from some publications have not yet been curated, or are not available for display because of copyright restrictions. |
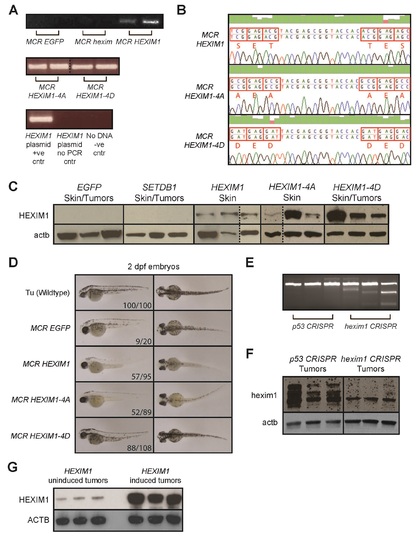
Validation of MiniCoopR HEXIM1 integration and overexpression in adult Tg(mitfa:BRAFV600E); p53-/-;mitfa-/- zebrafish, and examination of embryonic phenotypes, related to Figure 2. (A) MiniCoopR transient and stable lines were validated by extracting genomic DNA from tail fin clips of adult zebrafish. The region of human HEXIM1 that was mutated was then amplified by PCR. PCR was run on fin clips from MCR EGFP fish, MCR hexim1 fish, a HEXIM1 plasmid, a no-DNA control and HEXIM1 plasmid with no-PCR for comparison. The dotted line denotes that samples are from different gels. (B) PCR amplification products from (A) were sequenced to confirm strains containing WT HEXIM1, HEXIM-4A or 4D. A representative sequencing trace shows that amino acids S268, T270, T276 and S278 in human HEXIM1 were mutated to alanine in HEXIM1-4A and aspartic acid in HEXIM1-4D. (C) Three representative adult MiniCoopR-integrated zebrafish for each strain were sacked and protein was isolated from their skin or tumors if present. Western blots for human HEXIM1 and β-actin (actb) were then performed on these samples. The dotted line denotes that samples are from different gels. (D) EGFP, HEXIM1, HEXIM1-4A and HEXIM1-4D MiniCoopR transgenic zebrafish lines generated from the tumor onset experiment in Figure 2 were outcrossed with the Tg(mitfa:BRAFV600E);p53-/-;mitfa-/- strain (strain with no MiniCoopR integration) to give rise to offspring. Side and dorsal views of these offspring, 2 dpf zebrafish embryos, are shown. Also shown are embryos from an incross of the Tu wildtype strain for comparison. (E) T7E1 genotyping assay for hexim1 mutation in 20 week old Tg(mitfa:BRAFV600E);p53-/-;mitfa-/- zebrafish expressing either a p53 or hexim1 gRNA under the MiniCoopR system. Cleavage bands are detected when there is a DNA heteroduplex caused by mutation. (F) Three representative adult p53 or hexim1 CRISPR zebrafish were sacked and protein was isolated from their tumors. Western blots for hexim1 and β-actin (actb) were then performed on these samples. (G) Protein was isolated from three representative A375-HEXIM1 mouse xenograft tumors from either the HEXIM1 uninduced (no doxycycline diet) or HEXIM1 induced (doxycycline diet) mice. Western blots for HEXIM1 and β-actin (ACTB) were performed on these samples. |
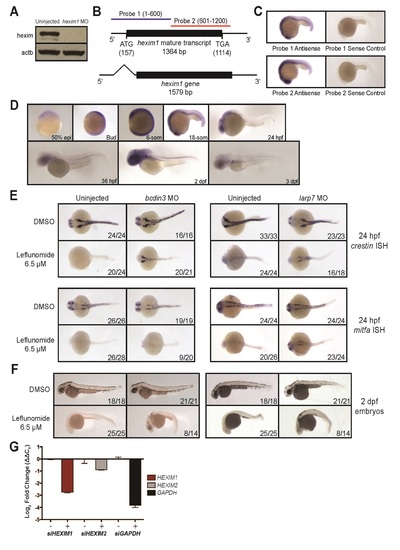
Knockdown of bcdin3 and larp7 rescues nucleotide stress-induced phenotypes in the neural crest where hexim1 is expressed, related to Figure 3. (A) Western blot for hexim1 and β-actin (actb) in uninjected and 8 ng of hexim1 MO injected embryos at 24 hpf. (B) Two 600 bp in situ hybridization probes to the mature hexim1 transcript were designed. (C) Both antisense probes and their corresponding sense controls were tested on 18-somite stage zebrafish embryos (~20 embryos per condition). (D) Zebrafish hexim1 expression at various developmental stages with probe 1 (~20 embryos per stage). Results are identical if probe 2 is used. (E) Zebrafish embryos were injected with 10 ng of bcdin3 or 12 ng of larp7 MOs that were previously published. Embryos were treated with either DMSO or 6.5 µM leflunomide at 50% epiboly and subjected to in situ hybridization at 24 hpf for crestin and mitfa expression. Dorsal views of embryos are shown. Numbers indicate the number of embryos with the shown phenotype vs. the total number of embryos in the clutch. (F) Embryos treated as described in (E) were also scored for melanocytes at 2 dpf. (G) Real time RT-PCR validation of HEXIM1, HEXIM2 and GAPDH knockdown in the A375 cells by pooled siRNAs (mean of 3 replicates ± SD). Data is normalized to ACTB. EXPRESSION / LABELING:
|