
- Title
-
Brain-wide mapping of neural activity controlling zebrafish exploratory locomotion
- Authors
- Dunn, T.W., Mu, Y., Narayan, S., Randlett, O., Naumann, E.A., Yang, C.T., Schier, A.F., Freeman, J., Engert, F., Ahrens, M.B.
- Source
- Full text @ Elife
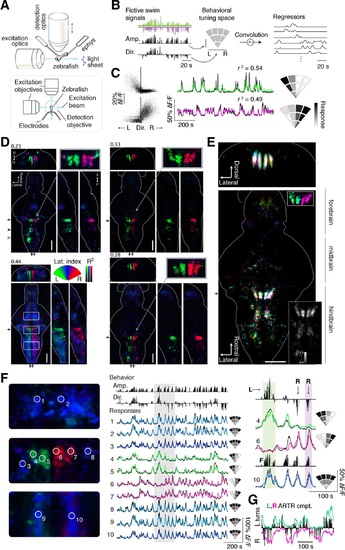
Whole-brain analysis identifies neural structures correlated with turning behavior.(A) Schematic of experimental paradigm for fictive swimming combined with light-sheet imaging (′Materials and methods′). (B) Schematic of analysis technique. Left: First, fictive swim signals are converted into measures of swim amplitude (′Amp′) and turning direction (′Dir′ for laterality). Middle: Next, amplitude and laterality are mapped onto the vertical and horizontal axes of a 2D space. This space is tiled with 12 basis functions, each representing a region in this 2D behavior space, now defined in polar coordinates (′Materials and methods′). Contours are shown for clarity; actual basis functions overlap by 50%. Right: The signal from each bin is convolved with an impulse response function to generate a regressor; an example subset of regressors is shown. (C) Brain activity is regressed against the regressors constructed in (B) to generate a behavioral tuning function for every voxel. Voxels of two example neurons are shown here. Left, relationship between turn laterality and neural response for the two example neurons, each dot is a time point. Middle, time series from the same two example neurons. Black line, ΔF/F; colored line, prediction of best-fitting model (see panel B). Right, behavioral tuning for the same two neurons, given by regression coefficients, using the analysis described in panel B; grayscale ranges from 10th to 90th percentile of the coefficient weights. (D) Behavioral tuning maps across the brain derived from fitting every voxel with the regressors described in panel B, for four representative fish. Calcium indicators are either localized in cytoplasm (left two fish) or in the nucleus (right two fish). The dorsal view is a maximum intensity projection over the whole brain; the side and front views are taken from a maximum intensity projection of 21 slices (~10 µm) along the medial-lateral axis and rostral-caudal axis, respectively. Numbers above each panel indicate the R2 value at which the color map saturates (maximum R2 value is higher), color maps start at R2 = 0. Arrows in each panel represent the centroid position of these slices for the frontal view (top) or side view (right). Solid arrowhead: diffusive correlated region in rhombomeres 4-6. Open arrowhead, inferior olive. Scale bar, 100 µm. D, dorsal; V, ventral; A, anterior; P, posterior. (E) Registered map from seven different fish (nuclear localized GCaMP6f) to a standard brain. Each fish is encoded by a different color; brightness represents R2. Bottom, top-down maximum intensity projection (along the dorsal-ventral axis). Top, front projection as in d, with the centroid of the slice indicated by the arrow in bottom panel. Top right inset, ARTR region across fish in the standard brain, but with color representing laterality as in panel d, showing consistent tuning across animals. Bottom right inset, a measure of stereotypy in location of functionally identified neurons across the 7 fish. Intensity represents the standard deviation divided by the mean of R2 (thresholded at 0.04). Scale bar, 100 µm. (F) Example ΔF/F traces from regions of interest (ROIs) in panel (D) (left bottom, white boxes). Left, top to bottom: midbrain, ARTR, and caudal hindbrain. Middle, top, signals of swim amplitude (Amp.) and turn laterality (Dir.). Black bars represent several individual swim events. Bottom, ΔF/F from ROIs in the left panels. Right, enlarged view of gray region in middle panel. L,R,F stand for left turns, right turns and swim amplitude, respectively. Responses from ROIs 1-3 and 8-10 show tuning to swim amplitude; ROIs 4,5 to left turns, and ROIs 6,7 to right turns. (G) In addition to single cells, activity of left and right populations derived with ICA (Figure 2-figure supplement 1C-E; bottom-right fish of Figure 2D) tracks turning behavior. |
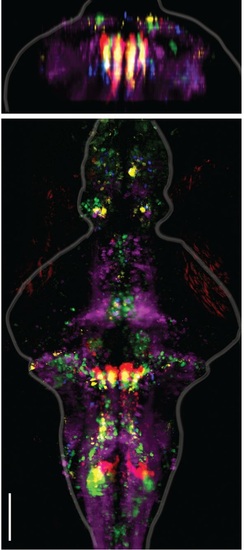
Alignment of functional brain maps in fish expressing calcium indicators in the cytosol. Shown here is the overlay of brain maps of transgenic zebrafish expressing calcium indicators in the cytosol of neurons (Tg(elavl3:GCaMP6f) and one Tg(elavl3:GCaMP5G) fish). In comparison to Figure 2E, which shows the overlaid maps for fish expressing calcium indicators only in the nuclei of neurons, the functionally identified neurons occupy the same locations, co-localize across fish, and are consistent with the locations of the ARTR as identified in Ahrens et al. 2013. Analyses are identical to those used in Figure 2. Scale bar, 100 µm. |
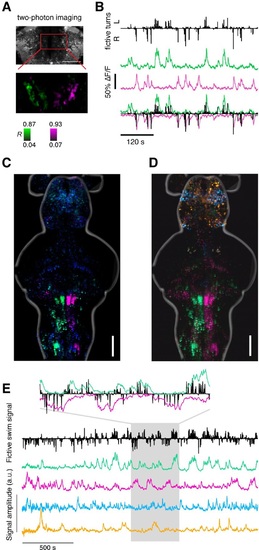
Recovering the ARTR using supervised and unsupervised methods. (A) Two-photon imaging during fictive behavior recovers the ARTR in one plane by correlating every pixel to a seed voxel. This antiphasic correlation pattern was observed in all fish imaged, including fish used for neurite tracing and neurotransmitter analysis, N = 69 total. (B) Fictive turns (black bars) and neural activity (average over magenta and green populations) shows the correlation between two-photon ARTR signal and turning behavior. (C) Map derived from regression analysis relating behavioral parameters (turn direction and amplitude) to neuronal responses (see Figure 2 and ′Materials and methods′), conventions as in Figure 2. (D) Maximum projection maps derived from Independent Component Analysis (ICA), performed as described in Freeman et al. (2014). Analysis was applied to voxel-wise time series data using 100 principal components and 20 independent components. Spatial maps for 4 out of 20 components shown here, combined into a composite color image by scaling amplitude to a (black, red/green/cyan/magenta) color range, separately for each of the 4 components, and then computing a maximum over the vertical dimension. Location of the ARTR is consistent with that from Freeman et al. (2014) and Ahrens et al. (2013). One representative fish is shown, but the ICA analysis was able to recover the ARTR consistently in 5 fish tested. (E) Temporal components for the same ICA analysis shown in panel (D). Fictive swim signal as defined in Figure 2. The four colored traces correspond to the four spatial maps in panel (D). Inset highlights components (magenta and green) that recover a region including the ARTR; one signal inverted to emphasize correspondence with behavior. |
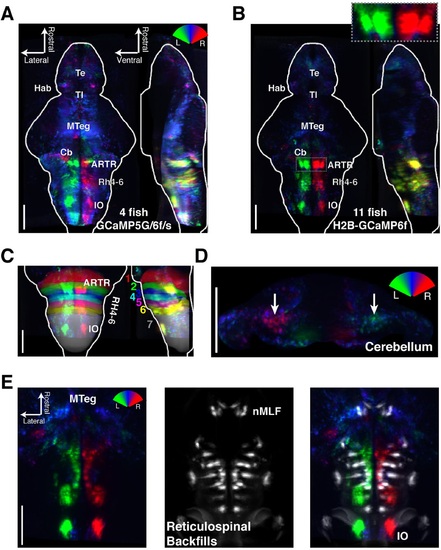
Functional anatomy of brain regions correlated with spontaneous behavior. Activity patterns consistently observed across fish highlighted by registering multiple fish to the Z-Brain atlas and averaging functional signals (see Supplementary methods). (A) Average functional stack resulting from Tg(elavl3:GCaMP6f) (N=2), Tg(elavl3:GCaMP5G) (N=1) and Tg(elavl3:GCaMP6s) larvae (N=1). Color represents tuning to fictive turning as in Figure 2. (B) Average functional stack resulting from Tg(elavl3:H2B-GCaMP6f) larvae (n=11). (C-E) Anatomical analyses of the average Tg(elavl3:H2B-GCaMP6f) maps in (B). (C) The positioning of hindbrain within the rhombomeres. (D) Untuned and some more weakly direction selective signals observed in the cerebellum. (E) Virtual colocalization comparing the position of ventral hindbrain and midbrain tegmentum (M-Teg) signals with the reticulospinal system. R2 = 0...0.12 (A-C), 0...0.06 (D-E). Scale bars, 100 &181;m. (Te) telencephalon; (Hab) habenula; (Tl) torus longitudinalis; (Cb) cerebellum; (ARTR) anterior rhombencephalic turning region; (Rh4-6) rhombomeres 4-6; (IO) inferior olive; (nMLF) nucleus of the medial longitudinal fasciculus. |
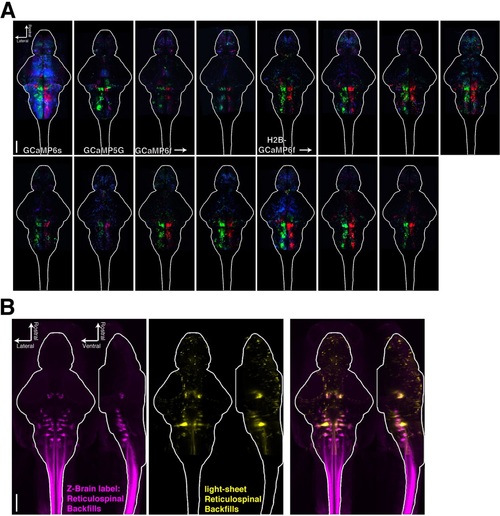
Registering brains to the Z-Brain atlas. (A) Functional stacks from 15 fish aligned to the Z-Brain atlas. (B) Comparison of the reticulospinal backfill label in the Z-Brain atlas, with the mean reticulospinal backfills from 4 fish imaged by light sheet microscopy and aligned to the Z-Brain atlas using the Tg(elavl3:H2B-GCaMP6f) transgenic fish line. |
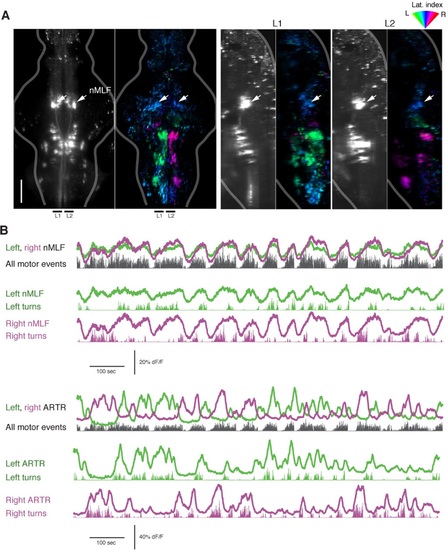
The nMLF is correlated with swim amplitude but not direction. (A) Left, light-sheet micrograph of the backfilled reticulospinal system (grayscale, dextran-conjugated TxRed, see ′Materials and methods′) and GCaMP6f regression map from the same fish. Right, sagittal views of the same fish, projected across the regions L1 and L2, as indicated to the left. Arrows in all maps point to the overlap between zones of blue-tuned regions in the functional brain maps and the backfilled nMLF neurons. The nMLF is activated by swimming, but not strongly tuned to direction. (B) Top, fluorescence time series for left and right nMLF ROIs with corresponding fictive behavior. Bottom, for comparison to nMLF tuning, fluorescence time series for left and right ARTR ROIs with corresponding fictive behavior. |

The ARTR biases turn direction. (A,B) Unilateral laser ablation of a subset of cells in the ARTR reduces ipsilateral turns. (A) Example swim trajectories, shown over a subset of the duration of the experiment, and (B) summary of turning behavior before and after laser ablation of cells in the left medial cluster (green) or right medial cluster (magenta) of the ARTR. Gray, data from sham ablations of hindbrain neurons outside of the ARTR. Only events occurring more than 1 cm away from the wall were analyzed. (C) Mean turn angle to the lesioned or intact side, before and after ablation. Although the relative frequency of turns to the ablated side decreases (B), fish remain capable of executing turns of normal magnitude to the lesioned side, with no significant difference in mean turn angle between pre- and post-ablation conditions. (D) Schematic of hypothesized changes to swim structure, assuming that the ARTR is involved in setting correlational patterns. Before and after ablation, turn patterns will be compared to a ‘coin flip’ model that emits turns to the left and right randomly but with some bias equal to the observed data. (E) Empirical cumulative distribution functions (CDFs) of streak length before (blue, top) and after (red, bottom) ablation, compared to model fish executing turns at random without history dependence but with overall turn bias matched to each individual fish (black). Streak length post-ablation appears distributed more like ′coin flips′. (F) Top, quantification of the squared residuals between each individual fish CDF and its matched ′coin flip′ CDF before (blue) and after (red) ablation. Bottom, the difference between each respective before and after curve reveals a shift toward the ′coin flip′ distribution for the majority of fish. (G) Summary of the normalized root-mean-square error (NRMSE) quantifying goodness-of-fit between the observed streak distributions and their matched random model distributions. After ablation, turning becomes more ‘coin flip’-like and thus history dependence is reduced. (H-L) Optogenetic stimulation of the ARTR elicits ipsilateral turn biases. (H) The ARTR was functionally identified in double transgenic fish Tg(elavl3:H2B-GCaMP6f;elavl3:ReaChR-TagRFP-T) and a medial ARTR cluster was unilaterally stimulated. Gray, expression of ReaChR-TagRFP-T; green and magenta, functionally identified ARTR from this example fish based on correlational map. (I) Ipsilateral turn bias increases during optogenetic stimulation (solid lines, 5 s stimulation; dotted lines, 8 s stimulation, N = 7 fish, ′Materials and methods′). (J) Results from example fish show the reproducibility of stimulation effect across trials. Turn direction is normalized to time-averaged turn direction pre-stimulation. (K) Summary of the change in bias quantified for each fish, showing that optogenetic stimulation results in a bias toward ipsilateral turns. (L) Summary of the change in absolute fictive turn angle during stimulation, showing that ipsilateral turn angle increases and contralateral turn angle remains unchanged. n.s., no significance; (*) p<0.05; (**) p<0.01 (paired signed rank test). All error bars are mean ± SEM across fish. |
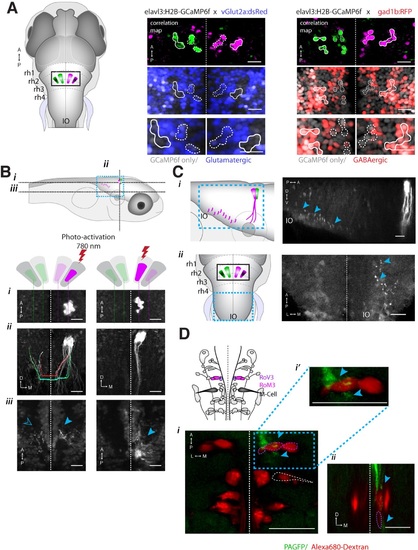
ARTR anatomy suggests mutual inhibition and connections to premotor neurons. (A) The medial ARTR is glutamatergic and the lateral ARTR is GABA-ergic. Left, Anatomical diagram showing the approximate location of the ARTR (black box) in rhombomeres 2–3. Green and magenta represent clusters influencing left and right turns, respectively. Right, The ARTR was functionally identified in two-photon imaging sessions (′Materials and methods′) in transgenic fish expressing H2B-GCaMP6f in most neurons and a red indicator either in the glutamatergic (left) or in the GABAergic (right) neurons. Overlaying the functional maps (top) in which the ARTR cells are identified by correlation reveals that the center clusters (dotted outlines) are glutamatergic and the lateral clusters (solid outlines) are GABAergic. For the vGlut experiments, N = 25 fish; GAD experiments, N = 11 fish; one representative fish shown for each. Scale bars, 20 µm. (IO) inferior olive; (rh1-4) rhombomeres 1-4. (B) The lateral ARTR projects contralaterally. Top, Anatomical diagram showing the approximate location of the planes shown below in (i), (ii), and (iii). The ARTR was identified as in (A) in Tg(H2B:GCaMP6f; α-tubulin-PAGFP) fish and PA-GFP was activated specifically in ARTR neurons of either the lateral cluster (left panels) or medial cluster (right panels). Projections were traced, revealing that the GABAergic cells of the lateral cluster cross the midline (dotted white line) toward the contralateral clusters (ii, left). The medial glutamatergic clusters project ventrally and ipsilaterally but were not found to cross the midline (ii and iii, right). Solid blue arrowheads, neurites in the hemisphere ipsilateral to the activated ARTR. Open blue arrowhead, neurites in the hemisphere contralateral to the activated ARTR. (C) Cells of the medial ARTR project to the ipsilateral IO. (i) The ARTR was functionally identified and photoactivated as in (B) in fish expressing PA-GFP and a red calcium indicator (Tg(elavl3:jRCaMP1a)). Left, schematic of the ARTR and PA-GFP-positive neurites projecting from the medial ARTR cluster and terminating in the IO (pink). Blue dashed rectangle represents the location of the region shown on the right. PA-GFP positive terminals are observed in the ipsilateral IO (blue arrowheads) (ii) Left, schematic showing the location (blue dashed rectangle) of (right) the top-down confocal image of the terminals shown in (i). (D) Cells of the medial ARTR send projections to a region nearby reticulospinal neurons. Top left, schematic of the reticulospinal system, adapted from Orger et al. (Orger et al., 2008), with RoV3, RoM3 and the Mauthner cell highlighted (Mauthner cell out of plane). (i) PA-GFP positive neurites (blue arrowheads) shown nearby RoV3 / RoM3 in fish where the reticulospinal neurons were retrogradely labeled with Alexa-680-dextran (red); panel (i′) shows a magnification of the boxed region. (ii) A coronal view of the two cells (RoV3/RoM3) shown in (i) and inset. Scale bars, 20 µm. A, anterior; P, posterior; L, lateral; M, medial; D, dorsal; V, ventral. |
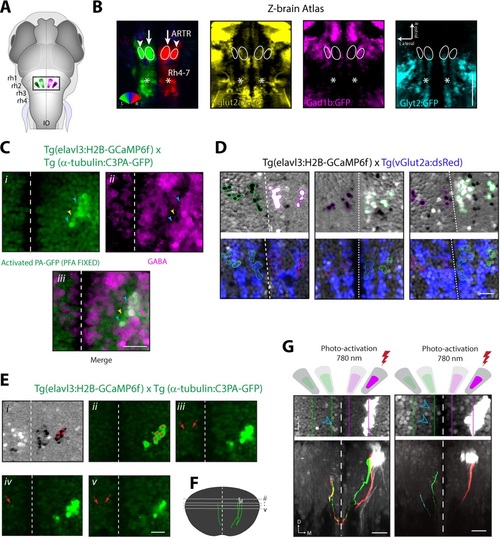
Cells of the lateral ARTR are inhibitory and project to the contralateral hindbrain. (A) Schematic of a 6 dpf zebrafish brain indicating the approximate location of the ARTR in the dorsal hindbrain. (B) Virtual colocalization comparing the location of the ARTR and caudal hindbrain signals relative to Z-Brain neurotransmitter labels. (C) Cells of the lateral ARTR are still marked with photoactivated PA-GFP after fixation in 4% PFA-PBS. N = 12 fish, one representative fish shown. (Ci-Ciii) A majority of the GFP-positive cells are reactive with GABA primary antibody (cyan arrows), with a minority of exceptions (yellow arrows). (D) Three additional example fish showing vGlut2a-expressing neurons enriched in the medial ARTR clusters. Top row, correlation maps of ARTR activity. Bottom row, vGlut2a expression. (Ei) Correlation map of ARTR activity. Cells of the right lateral cluster were identified (red asterisks) and photoactivated (red asterisks). (Eii-Ev) Four different slices (dorsal to ventral) showing the photoactivated cells (right of the midline) and PA-GFP-positive processes on the contralateral side (red arrows). N = 37, one fish shown. (F) Reconstruction of traced photoactivated neurites (not all neurites were traced). The approximate levels of the slices in Eii-Ev are indicated. The cells project dorso-ventrally and turn toward the midline, at which point they could not be followed anymore in this example. Processes reappear on the contralateral side. In this example, the traced neurite terminates in the vicinity of the contralateral medial ARTR cluster. The vertical dimension of the ARTR is 83 ± 8 µm (mean ± SD, 6 fish). (G) Two additional example fish showing projections from the lateral ARTR cluster to the contralateral ARTR cluster. Note that only a subset of ARTR neurons are activated and that the entire ARTR structure spans approximately 80 microns along the dorso-ventral axis. Out of 10 fish manually traced, all 10 had detectable projections from the lateral cluster to the medial cluster on the contralateral side, and 5 had detectable projections to the lateral cluster on the contralateral side. Scale bars: 20 µm. Dashed white lines, brain midline. |
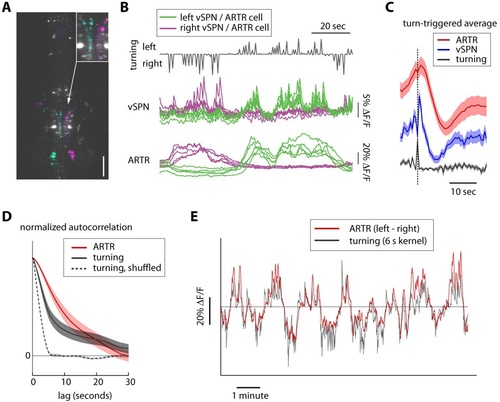
Timescales of reticulospinal, ARTR and turn state correlations. (A) Ventromedial cells (vSPNs) in the hindbrain reticulospinal system (identified via spinal backfills, white) are correlated with turning behavior. Cyan and magenta show GCaMP6 voxels with laterality indices to the left and right, respectively. N = 4; one fish shown. Scale bar, 100 µm. (B) Example traces from 10 vSPNs (middle) and 10 ARTR neurons (bottom) during fictive swimming. ARTR neurons are active on longer timescales than vSPNs. (C) Quantification of ARTR (red) and vSPN (blue) response dynamics triggered on turns (gray). Only turns that were not followed by another turn in the same direction for at least 5 s were included to isolate ARTR dynamics from correlation in behavior. The ARTR signals are slower than the vSPN signals (as measured with the calcium indicator), and peak about 1.5-2 s after a turn, compared to a near-instantaneous peak in the vSPN signals, suggesting feedback from (peripheral) motor circuits to the ARTR. ARTR analyses use pooled data from both medial and lateral clusters (shown separately in Figure 2-figure supplement 3). (D) Normalized autocorrelation of ARTR signals (red), convolved turn laterality (gray), and convolved turn laterality after shuffling turn identity (dotted). ARTR activity and turning is correlated on similarly slow timescales. The length of the shuffled correlation reflects the width of the convolution kernel. (E) Convolved turning behavior (gray) matches the instantaneous difference between left and right ARTR fluorescence. ARTR analyses use pooled data from both medial and lateral clusters. |
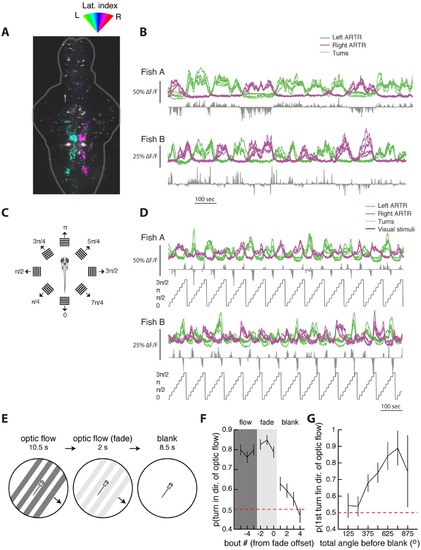
The ARTR is recruited by whole-field motion. (A) Laterality tuning map for one fish, showing the characteristic long-timescale correlations with fictive behavior (B). This map is used to choose left and right ARTR ROIs that are used to assay ARTR responses to different directions of whole-field motion (C). (D) Responses of the ARTR ROIs to the eight directions of motion indicated in (C). This periodic motion paradigm drives turning strongly for orthogonal directions of motion and drives ARTR activity periodically, with the left ARTR activated for stimuli oriented to the left and the right ARTR activated for stimuli oriented to the right. (E) Experimental paradigm designed to test the effect of ARTR activation by whole-field motion. Freely swimming larvae are presented with drifting gratings moving orthogonal to the body axis, either to the left or the right, depending on the trial. These gratings are presented with closed-loop feedback such that they are always locked to the fish’s body axis even as the fish swims around the petri dish. This stimulus drives turning in the direction of motion. After 10.5 s of optic flow, the gratings fade away linearly over 2 s, and behavior is monitored under subsequent spontaneous conditions for 8.5 s. (F) The probability of turning in the direction of flow reaches a maximum during the flow and fade epochs but stays elevated above chance for three bouts into the null epoch. (G) The direction of the first swim bout following visual stimulation is strongly related to the amount of turning during optic flow. The more the fish turns during optical stimulation, the higher the chance that the first swim bout in the blank period is in the same direction (22 fish) Figure 6G-H. |