
- Title
-
c21orf59/kurly Controls Both Cilia Motility and Polarization
- Authors
- Jaffe, K.M., Grimes, D.T., Schottenfeld-Roames, J., Werner, M.E., Ku, T.J., Kim, S.K., Pelliccia, J.L., Morante, N.F., Mitchell, B.J., Burdine, R.D.
- Source
- Full text @ Cell Rep.
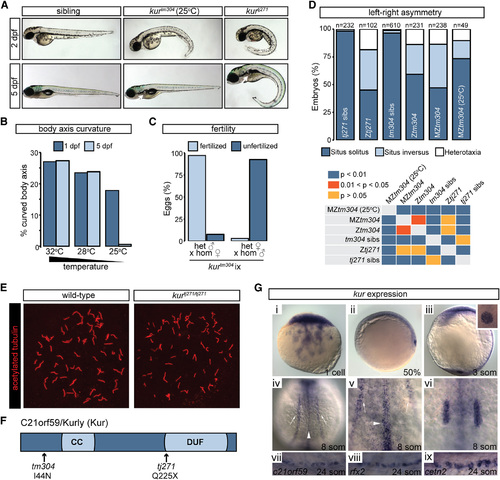
kur Mutants Harbor Mutations in c21orf59 and Exhibit Defects Characteristic of Defective Cilia Motility (A) Lateral views of zebrafish sibling control embryos and kurtm304 and kurtj271 mutants at 2 dpf and 5 dpf. At 25°C, kurtm304 mutants exhibit early body axis defects that resolve by 5 dpf, whereas kurtj271 mutants do not resolve their body curvatures. Both mutants exhibit kidney cysts (white arrows), but the penetrance is variable in kurtm304/tm304 at 25°C. (B) Embryos from kur+/tm304 intercrosses were raised at 32°C, 28°C, or 25°C and were scored for body curvature defects at 1 dpf and 5 dpf. While abnormalities were present in around 25% of embryos at 32°C and 28°C, mutants raised at 25°C exhibited fewer incidences of axis curvature at 1 dpf and almost all mutants had recovered at 5 dpf. The total number of embryos examined was 32°C, n = 292; 28°C, n = 332; and 25°C, n = 341. Shown is the average percentage of embryos with curved body axis from four biological replicates. (C) Fertility of kurtm304 adult mutants was assessed by scoring the number of fertilized eggs following homozygous female crosses to heterozygous males and vice versa. Shown is the average percentage of embryos fertilized from three biological replicates. (D) Percentage of embryos showing the indicated situs phenotypes. The embryos were processed by ISH for myl7, ins, and fkd2 to mark the heart, pancreas, and liver, respectively, at 2 dpf. The statistical comparison of different genotypes was performed using chi-square analysis with p < 0.05 being considered to report significant differences. (E) Early somite-stage (ss) embryos were processed for immunostaining using acetylated alpha-tubulin antibodies to mark the ciliary axoneme. The confocal imaging of KV revealed the presence of cilia in sibling control embryos as well as kurtj271tj271 mutants. (F) Schematic diagram of C21orf59/Kur protein showing the approximate positions of the predicted CC domain and the DUF. The position and nature of the kurtm304 (I44N) and kurtj271 (Q225X) mutations are shown. (G) kur expression in zebrafish embryos at the stages indicated. kur is provided maternally at the 1-cell stage (i), followed by expression in the DFCs at 50% epiboly (ii). The expression is observed in KV (iii), pictured here at the 3-ss with a close-up of KV in the inset. During somitogenesis, kur is expressed in tissues with motile cilia including the pronephros (white arrows), the floorplate of the NT (white arrowheads), and the otic vesicles (iv-vi). Expression in the pronephros at the 24-ss overlaps with MCC markers rfx2 and cetn2 (vii-ix). EXPRESSION / LABELING:
PHENOTYPE:
|

Kur Is a Cytoplasmic Factor Required for the Localization of ODAs to the Cilium (A-D′) Transmission electron micrographs (TEMs) showing the ultrastructure of pronephric cilia in cross-section. The arrows in (A) and (A′) indicate ODAs that are missing in mutants (B-C′), but are restored in kurtm304/tm304 mutants raised at permissive temperature (D and D′). (E) IP of Myc-tagged Swt and subsequent Myc-Swt and FLAG-Kur western blot (WB) reveals physical association between Swt and Kur. (F-G′) NIH 3T3 cells transfected with inducible Myc-tagged Kur were immunostained for the ciliary axoneme (acetylated alpha tubulin [ac-tub]; red), DNA (Hoechst; blue), and myc (Myc-Kur; green). The Kur is not localized to the cilium, but instead localizes to the cytoplasm. (H-I′) Immunostaining of KV in control embryos or embryos injected with Myc-Kur. The cilia were marked by ac-tub (green) staining, DNA with Hoechst (blue), and Myc-Kur was localized with an anti-Myc antibody (red). The Myc-Kur, which rescues kur mutants, was present in cells of the KV, but appeared absent from cilia themselves. EXPRESSION / LABELING:
PHENOTYPE:
|
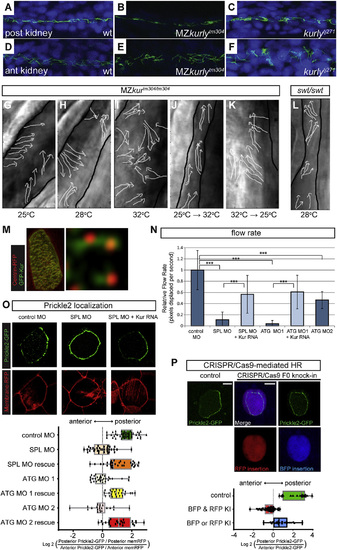
kur Mutants and Morphants Exhibit Polarity Defects in Zebrafish and Xenopus (A-F) Staining of cilia axonemes (ac-tub; green) and nuclei (Hoechst; blue) in zebrafish pronephric tubules show cilia are present, but appear disorganized and mispolarized in mutants. (G-L) Stills from live imaging of cilia. The cilia directionality is traced by the arrows in the MZkurtm304/tm304 (G-K) and the lokto237b/to237b mutants (L). The black outlines mark the edges of the tubules. The cilia in MZkurtm304/tm304 are progressively more disorganized at higher temperatures (G-I). Temperature shift experiments in kurtm304/tm304 mutants show that cilia do not become disorganized after shifting from permissive to restrictive temperatures (25°C→32°C) (J) and that cilia are able to recover their alignment defects by shifting from restrictive to permissive temperatures (32°C→25°C) (K). The swt/swt mutants exhibit dilated tubules, but normal cilia alignment (L), suggesting that tubule dilation does not cause alignment defects. (M) Cytoplasmic localization of GFP-Kur in a Xenopus MCC showing an enrichment at the basal body and rootlets (inlay). (N) Quantification of cilia generated fluid flow in control embryos and kur morphants. The average flow velocity measured by the displacement of dyed micro-beads along the skin of stage 29 Xenopus embryos is shown. The data represent three independent MOs and rescue experiments were performed with GFP-Kur RNA. The values are averages of at least ten flow lines from five embryos from two independent experiments. The error bars indicate SD and ***p value < 0.0002. (O) Representative images and quantification of Prickle2-GFP (green) and membrane-RFP (red) localization in control and kur morphants (posterior is right). The box and whisker plots represent the log2 of the posterior fluorescent intensity divided by the anterior fluorescent intensity normalized for memRFP intensity. (P) Representative images and quantification of Prickle2-GFP localization in mosaic F0 CRISPR/Cas9-edited MCCs. The control embryos were injected with Cas9 protein and homology arms without kur gRNA. RFP positive MCCs indicate integration of RFP into the short kur allele, and BFP positive MCCs indicate integration of BFP into the long kur allele. The box and whisker plot represent the log2 of the posterior Prickle2-GFP fluorescent intensity divided by the anterior fluorescent intensity. |

Kur Interacts with PCP Components (A-C) Low concentration of inv or kur MO produce few defects, but, in combination, produce additive defects in body curvature and presence of kidney cysts. The white arrows show kidney cysts. The statistical comparison of different genotypes was performed using chi-square analysis with p < 0.05 being considered to report significant differences. (D) IP of FLAG-tagged Dvl and subsequent FLAG-Dvl and HA-Kur western blot (WB) reveal physical association between Dvl and Kur. (E) IP of Myc-tagged Dvl domains and subsequent Myc-Dvl and HA-Kur western blot (WB) reveal physical association between Kur and the DEP and PDZ domains, but not the DIX domain of Dvl. (F) IP of FLAG-tagged Kur and subsequent FLAG-Kur and HA-Sea western blot (WB) reveal physical association between Sea and Kur. PHENOTYPE:
|
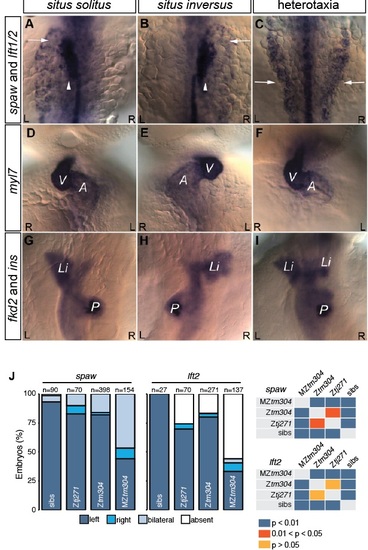
Related to Figure 1. Laterality Defects in kur Mutants. (A-I) WISH for spaw, lft1/2 as well as makers of the heart (myl7), liver (fkd2) and pancreas (ins) showing examples laterality defects observed in mutants. (J) Quantitation of spaw and lft2 expression patterns observed in mutants. Statistical comparison of different genotypes was performed using chi-square analysis with p < 0.05 being considered to report significant differences. |
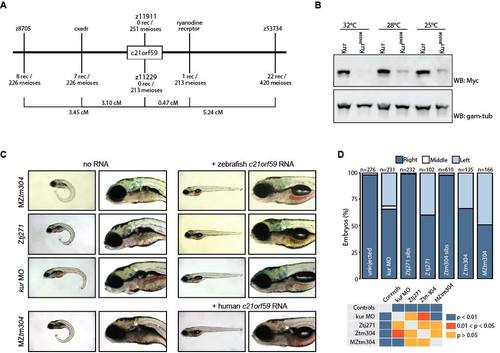
Related to Figure 1. kur Alleles Carry c21orf59 Mutations.(A) Schematic diagram of the region kur was mapped to, including c21orf59. (B) Western blot of Myc-tagged Kur after expression in zebrafish embryos which were subsequently raised at the given temperatures. At higher temperatures, wild-type Kur is present as a strong band but Kurtm304 protein has either not been generated or has decayed. Gamma-tubulin was used as a loading control. (C) kur mutants and morphants were rescued (body axis defect was completely rescued, whereas kidney cysts (white arrows) were partially rescued) by injection at the 1-cell stage of either zebrafish or human c21orf59 RNA. (D) Heart looping scored by myl7 ISH at 48 hpf; mutants and morphants exhibited laterality defects that were not present in uninjected or sibling controls. Statistical comparison of different genotypes was performed using chi-square analysis with P < 0.05 being considered to report significant differences. |
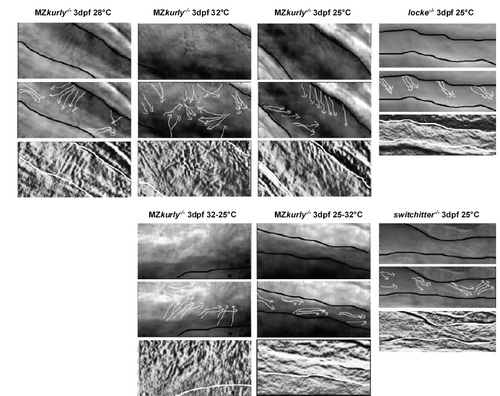
Related to Figure 3. Kidney Cilia Polarization is Altered in kur Mutants. Stills of live imaging of mutant kidneys at 3 dpf. Black and white lines mark the edges of the pronephros whilst white lines show the direction of cilia. PHENOTYPE:
|
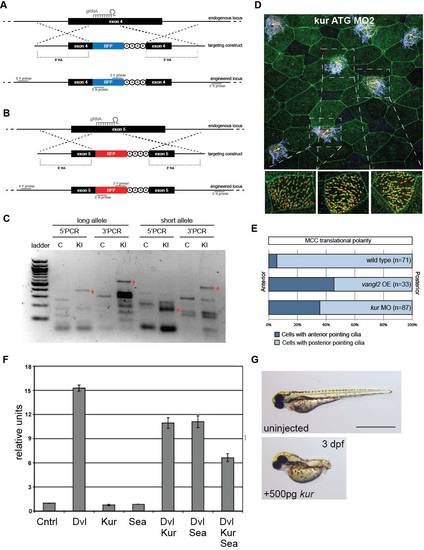
Related to Figure 3. Generation of Xenopus kur Mutants, Tissue-Level Polarity Defects, and Repression of Canonical Wnt Signaling by Kur. (A-C) Schematic diagram of CRISPR/Cas9-induced homologous recombination (HR) knock-in (KI) strategy. A single guide RNA (gRNA) cuts both the long and short kur alleles, then targeting constructs with allele-specific homology arms (HA) are used to integrate BFP (A) and RFP (B), respectively, into the endogenous locus, followed by termination codons and a polyA tail. PCR using a BFP- or RFP-specific primer and a primer outside the region of homology (C) indicated successful KI in F0 mosaic embryos. (D-E) Tissue level polarity is perturbed when kur is depleted. Representative image from a kur MO-treated embryo (ATG MO 2) expressing the rootlet marker GFP-CLAMP (green) and the basal body marker Centrin-RFP (red) stained with anti-acetylated tubulin antibody (purple) (D). Yellow arrows indicate average cilia orientation of individual ciliated cells. Three cells are enlarged without acetylated tubulin staining showing cilia orientation. Quantitation of ciliated cell polarity in control embryos, embryos overexpressing the PCP component vangl2, and kur morphant embryos (E). (F) Luciferase readouts of the Super8XTopFlash reporter. Expression of Dvl alone activates the reporter whereas coexpression of Dvl and Kur or Dvl and Sea reduces activity, which is further reduced by expression of Kur and Sea together. Error bars represent standard deviation. (G) Overexpression of kur by RNA injection at the 1-cell-stage induced moderate dorsalization. |