
- Title
-
Leptin signaling regulates glucose homeostasis, but not adipostasis, in the zebrafish
- Authors
- Michel, M., Page-McCaw, P.S., Chen, W., Cone, R.D.
- Source
- Full text @ Proc. Natl. Acad. Sci. USA

ZFIN is incorporating published figure images and captions as part of an ongoing project. Figures from some publications have not yet been curated, or are not available for display because of copyright restrictions. |
|
ZFIN is incorporating published figure images and captions as part of an ongoing project. Figures from some publications have not yet been curated, or are not available for display because of copyright restrictions. PHENOTYPE:
|
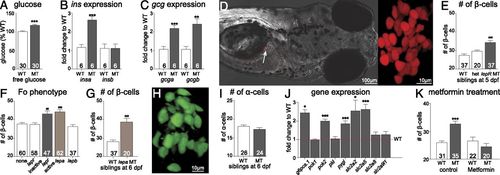
Glucose homeostasis phenotypes in normal and leptin receptor mutant larval zebrafish. (A) Whole-body free glucose in WT and leprsa1508/sa1508 mutant in-crosses collected at 6 dpf. A t test shows a significant difference between genotypes, t(58) = 5.179, P < 0.0001. (B) Expression of insa and insb mRNA at 6 dpf, determined by quantitative RT-PCR (qRTPCR). insa shows significant up-regulation t (10) = 6.058, P < 0.001, whereas insb does not t(10) = 0.016, P > 0.05, t tests. (C) Expression of gcga and gcgb mRNA levels, determined by qRTPCR. gcga t(10) = 4.973, P < 0.001 and gcgb t (10) = 4.232, P < 0.01 are up-regulated, t tests. (D) A representative image of a zebrafish carrying the β-cell marker [Tg(1.2ins:H2BmCherry)], and an enlarged image showing individual β-cells. (E) Numbers of β-cells in offspring of an in-cross of heterozygous leprsa1508/+ mutant animals at 5 dpf. Homozygous leprsa1508/sa1508 mutants exhibit a significant increase in β-cell number by one-way ANOVA, F(2, 93) = 18.69, P < 0.001, Bonferroni’s MCT. (F) Number of β-cells in animals at 6 dpf, following injection of embryos with Cas9 and guide RNA directed against lepr, lepa, or lepb genes; ANOVA F(4, 263) = 11.67, P < 0.0001, Bonferroni’s MCT. (G) Number of β-cells is significantly increased in larvae homozygous for a mutation in lepa compared with their WT siblings at 6 dpf. t test t(41) = 4.738, P < 0.001. (H) A representative picture of α-cells in fish carrying the transgene [Tg(gcg:GFP)]. (I) Numbers of α-cells observed in WT and leprsa1508/sa1508 mutant siblings from heterozygous leprsa1508/+ in-crosses at 6 dpf. There was no effect of genotype [t test t(24) = 0.96, P = 0.34]. (J) Data showing gene expression analysis of fry at 6 dpf compared with WT controls. t tests show an up-regulation of glucose 6 phosphatase (g6pca.1; t (9) = 7.059, P < 0.001), mitochondrial phosphoenolpyruvate carboxykinase (pck2; t (9) = 8.601, P < 0.001), liver glycogen phosphorylase [pygl; t(9) = 4.423, P < 0.01], glucose transporters 2 (scl2a2; t (9) = 2.808, P < 0.05) and 5 [slc2a5; t(10) = 5.160, P < 0.001], but not cytoplasmic phosphoenolpyruvate carboxykinase [pck1; t(9) = 0.4822, P > 0.05], liver pyruvate kinase (pklr; t (10) = 0.2263, P > 0.05), glucose transporters 8 [slc2a8; t(10) = 0.903 P > 0.05] or 9 [slc2a9l1; t(10) = 1.31, P > 0.05). (K) Effect of metformin on the developmental increase in β-cell number. Two-factor ANOVA shows an effect of genotype [F(1,107) = 4.785, P < 0.05] and treatment [F(1,107) = 12.56, P < 0.001]. A Bonferroni post test showed a significant elevation in the DMSO-treated leprsa1508/sa1508 mutant group. Data shown as means ± SEM. *P < 0.05; **P < 0.01; ***P < 0.001. |
|
ZFIN is incorporating published figure images and captions as part of an ongoing project. Figures from some publications have not yet been curated, or are not available for display because of copyright restrictions. |
|
ZFIN is incorporating published figure images and captions as part of an ongoing project. Figures from some publications have not yet been curated, or are not available for display because of copyright restrictions. PHENOTYPE:
|
|
Unillustrated author statements |