
- Title
-
The ciliary marginal zone of the zebrafish retina: clonal and time-lapse analysis of a continuously growing tissue
- Authors
- Wan, Y., Almeida, A.D., Rulands, S., Chalour, N., Muresan, L., Wu, Y., Simons, B.D., He, J., Harris, W.
- Source
- Full text @ Development
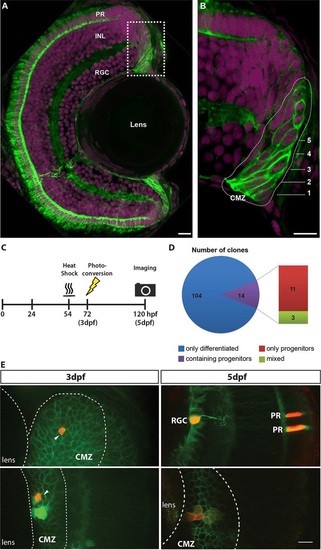
Short-term clonal analysis. Rx2 functions as a marker for the CMZ of the zebrafish retina. (A) A maximum intensity projection of a transverse 12µm section of a 5dpf zebrafish retina, showing the expression of the transgenic reporter Tg(Rx2:GFPcaax). Rx2+ cells (green) are found in the CMZ as well as in two cell types of the neural retina, photoreceptors (PRs) and Müller glia. (B) High-magnification 1µm section from a region of the CMZ (box in A), revealing that both RSCs (rings 1-2) and RPCs (rings 3-5) are Rx2+. Numbers indicate rings. Nuclei are labelled with DAPI (magenta). INL, inner nuclear layer; RGC, retinal ganglion cell layer. (C) Experimental procedure for labelling CMZ cells and capturing the short-term clonal composition. (D) Composition of short-term CMZ clones reveals the distinct proliferative fates in the CMZ population. (E) A single CMZ cell is photoconverted to red at 3dpf (top left, indicated by arrow) and the resultant terminated clone at 5dpf (top right, red) is shown with identified cell fates (RGC, retinal ganglion cell; PR, photoreceptors). Another example of a single CMZ cell photoconverted at 3dpf (bottom left, indicated by arrow) and the resultant maintained clone observed at 5dpf (bottom right, red). Note the dilution of the label in cells further from the lens, which is suggestive of more rapid division. In E, all Rx2+ cells have green membranes whereas the MAZe:Kaede cells have green cytoplasm that becomes red upon photoconversion. Scale bars: 10µm. |
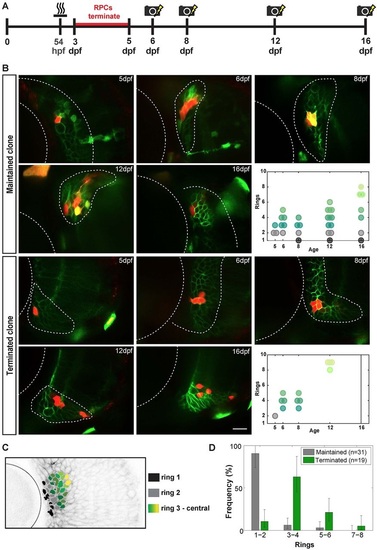
Long-term polyclonal analysis. (A) Experimental procedure for labelling 5dpf CMZ clones and following the maintaining CMZ polyclones at subsequent time points. (B) Photoconverted CMZ cells (red) at 5, 6, 8, 12 and 16dpf, with the top two rows showing a maintained polyclone and bottom two rows a terminated polyclone at 16dpf. Rx2+ cells have green membranes whereas the MAZe:Kaede cells have green cytoplasm that becomes red upon photoconversion. Yellow areas indicate colocalization of signals. Scale bar: 20µm. The final panels in each series show the clonal geometry of each of these two clones. Black circles indicate ring 1; grey circles, ring 2; dark green to light green, rings 3-8. (C) Frontal view of an Rx2+ retina, with the cell ring position coded in colour (as shown in key). (D) Distribution of the position of the most peripheral cells in clones on the last observed day for all maintained clones (n=31) and the corresponding value for all terminated clones before termination (n=19). Error bars represents one sigma confidence interval of Poisson distribution. |
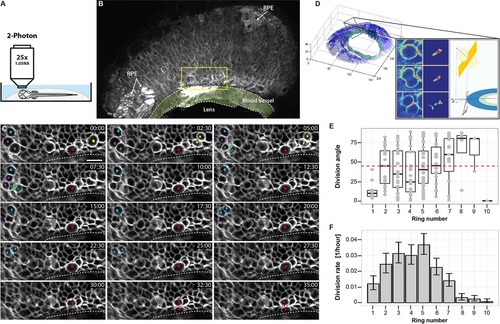
Live imaging of cell division in the CMZ. (A) Schematic illustration of the two-photon imaging set-up. (B) 3D projection of one movie frame (t=69, z=16.5µm), showing the CMZ region imaged. Arrows indicate areas of retinal pigment epithelium (RPE). Yellow rectangle represents the area shown in the following panels. The ring blood vessel is shaded light green. (C) Selected frames of a 4D time-lapse movie showing several cell divisions in a variety of orientation planes. Dividing cells are labelled with a coloured dot. A presumptive stem cell, dividing parallel to the edge of the retina close to the blood vessel, is labelled with a red asterisk. Each frame represents a maximum intensity projection (six frames, z=4.5µm). Elapsed time shown in min:s. Dotted line indicates the edge of the blood vessel. Scale bar: 10µm. (D) Computation of division angle. The 3D image stack is segmented into retina (blue) and blood vessel (green). Inset panel shows how the pixels belonging to the divisions are detected by analysing the difference between two consecutive or temporally close frames (depending on the time resolution of the imaging) and finding large contiguous volumes of statistically significant pixels in the difference image, followed by a manual validation step (see supplemental Materials and Methods). Once the divisions are detected, the normal of the division plane (yellow) is estimated and projected in the CMZ plane and the angle between the projected normal and the tangent to the CMZ circle at the closest point is computed. (E) Box plot of division angles detected in each ring of cells in the CMZ. Ring 1 cells divide more strictly axially compared with the random distribution in higher rings. Boxes span the first to the third quartile. Whiskers extend from the lowest value still within 1.5 interquartile range (IQR) of the lower quartile to the highest value still within 1.5 IQR of the upper quartile. (F) Estimated division rate in each ring of cells in the CMZ. Division rate is defined as the number of divisions observed divided by the number of cells imaged in the corresponding ring. Error bars represent one sigma confidence interval of Poisson distribution. |