
- Title
-
Cryptococcus neoformans Intracellular Proliferation and Capsule Size Determines Early Macrophage Control of Infection
- Authors
- Bojarczuk, A., Miller, K.A., Hotham, R., Lewis, A., Ogryzko, N.V., Kamuyango, A.A., Frost, H., Gibson, R.H., Stillman, E., May, R.C., Renshaw, S.A., Johnston, S.A.
- Source
- Full text @ Sci. Rep.
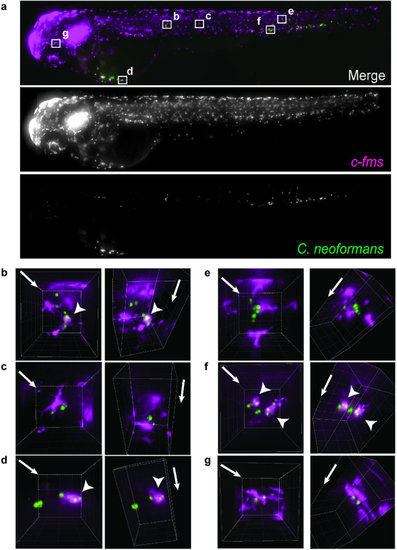
Quantification of macrophage behavior in response to Cryptococcus during infection.(a) Maximum intensity z-projection of example image data from high content imaging (see Supplementary Fig. S1) of Tg(fms:Gal4.VP16)i186 ; Tg(UAS:nfsB.mCherry)i149 zebrafish, with mCherry labeled macrophages (magenta), infected with 148 cells of C. neoformans strain H99GFP (green), at 2 hours post infection. (b-d) Areas boxed in (a) enlarged and reconstructed in three-dimensions. Arrowheads indicate intracellular cryptococci. Image pairs represent different views of same volume with arrows indicating z-axis direction. Image grid is 20 µm. Images are representative of a total of 120 infections from n = 3 repeats (40 infections per independent repeat group). |
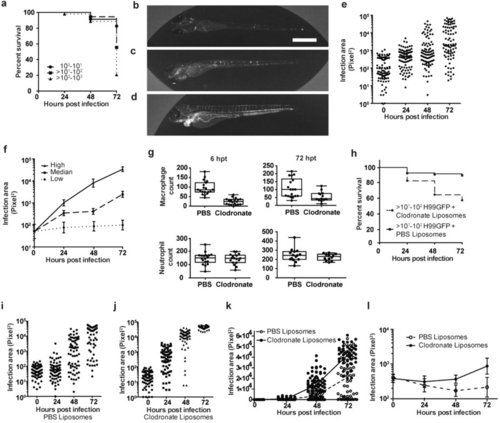
Macrophages are essential for control of cryptococcal fungemia.(a) Stratification of survival over 72 hpi from macrophage response data set. Survival is dependent on dose with a large change in survival between 101 and 103. 120 infections from n = 3 (each group contains: 100-101 = 23, >101-102 = 36, >102-103 = 53). (b-f) Representative images and quantitation of fungal burden from infections with inocula between >101-102 of Nacre-strain zebrafish (100 infections from n = 4). (b-d) Fluorescence images of low (b), median (c) and high (d). H99GFP infection of zebrafish at 72 hpi with inocula between >101-102. Scale bar is 500 µm. (e) Quantification of fungal burden using area of fluorescent pixels from C. neoformans strain H99GFP. Each point is a separate infection with inocula between >101-102, with the same 100 infections over 72 hours. (f) Stratification of (e) using 2log10 boundaries at 72 hpi. Geometric mean with 95% confidence intervals. (g) Zebrafish 24 hpf were injected with clodronate or PBS containing liposomes and the numbers of macrophages or neutrophils counted using Tg(mpeg1:mCherryCAAX)sh378 and Tg(mpx:GFP)i114 respectively at 6 and 72 hours post treatment. 15 treatments from n = 3. (h) Survival of Nacre-strain zebrafish infected with inocula between >101-102 of C. neoformans strain H99GFP at 48 hpf, following liposome treatment at 24 hpf. P < 0.0001, Log-rank (Mantel-Cox). hazard ratio = 4.5 (logrank; 95% confidence interval 3.2,7.7). 140 and 178 infections from clodronate and PBS groups respectively from n = 3. (i-k) Quantification of fungal burden using area of fluorescent pixels from Nacre-strain zebrafish infected with inocula between >101-102 of C. neoformans strain H99GFP at 48 hpf following treatment with liposomes at 24 hpf. Each point the same 75 infections over 72 hours from n = 3. (i) PBS (j) Clodronate (k) Linear comparison of individual infection and mean fungal burden values with PBS (open circles and dotted line respectively) or clodronate (filled circles and solid line respectively) treatment. Values are the same as presented (i) and (j). (l) Quantification of fungal burden using area of fluorescent pixels from Tg(mpeg1:mCherryCAAX)sh378 strain zebrafish infected with <5 × 101 of C. neoformans strain H99GFP at 48 hpf followed by injection with liposomes at 24 hpi (72 hpf). Points are geometric mean with 95% confidence intervals. The same 25 infections over 72 hours. |
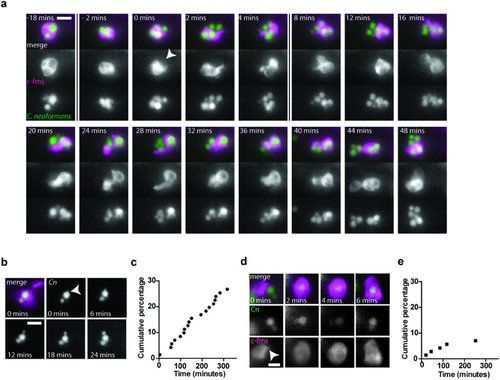
Increase in intracellular numbers of cryptococci is driven by proliferation not phagocytosis. (a,b,d) Fluorescent time lapse imaging of parasitism of macrophages. Tg(fms:Gal4.VP16)i186; Tg(UAS:nfsB.mCherry)i149 zebrafish, with mCherry labeled macrophages (c-fms; magenta), infected with C. neoformans strain H99GFP (green). Zebrafish were imaged for 12 hours from 2 hpi. Images were captured every 2 minutes. (a) Vomocytosis. Selected frames are presented before and after vomocytic event (0 mins). Arrowhead indicates the formation of concave macrophage membrane with vomocytosis. Vomocytosed cryptococci leave the imaged volume post 48 minutes (see Supplementary Movie S1). Scale bar 10 µm. (b) Intracellular proliferation. Selected frames are presented from when bud is first visible (arrowhead). (c) Quantification of intracellular proliferation from time lapse imaging. Each occurrence of intracellular budding yeast was counted over 12 hours. Data presented is a cumulative percentage of yeast that budded over the time of observation. (d) Phagocytosis. Selected frames are presented from formation of phagocytic cup (arrowhead). (e) Quantification of phagocytosis from time lapse imaging. Each occurrence of phagocytosis was counted over 12 hours. Data presented is a cumulative percentage of yeast that were phagocytosed over the time of observation. Quantitation of intracellular proliferation and phagocytosis are from 22 infected macrophages and are representative of n = 5. |
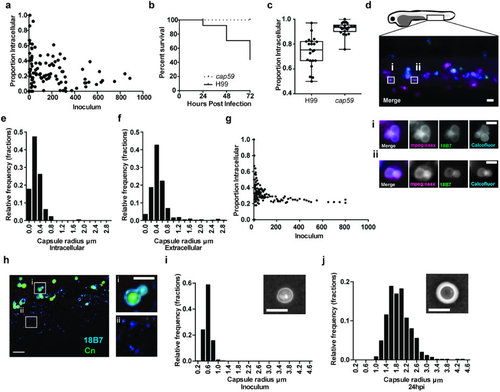
Polysaccharide capsule is smaller on intracellular cryptococci and is greatly enlarged after infection.(a) Association between inoculum and proportion of intracellular cryptococci. Each point is a separate infection. P-value 0.0499. 120 infections of Tg(fms:Gal4.VP16)i186 ; Tg(UAS:nfsB.mCherry)i149 zebrafish with C. neoformans strain H99GFP. (b) Survival of AB strain zebrafish infected with >102-103 C. neoformans strain H99 or mutant cap59. P < 0.0001, logrank (Mantel-Cox). hazard ratio = 10.1 (logrank; 95% confidence interval 5.6, 18.4). 89 and 81 infections from H99 and cap59 groups respectively, from n = 8. (c) Proportion of intracellular cryptococci 4 hours post infection of Tg(mpeg1:mCherryCAAX)sh378 with >101-102C. neoformans strain H99 or mutant cap59 labelled with Calcofluor white. Quantitation of 22 infected fish from n = 3 experiments. (d-f) In vivo measurement of intracellular and extracellular polysaccharide capsule radius. 1025 cryptococci were measured from 50 infections from n = 5 repeats. (d) Maximum intensity projection from three dimensional fluorescence imaging of Tg(mpeg1:mCherryCAAX)sh378 (magenta), that labels macrophage membranes, infected with inocula between >101-102 of C. neoformans strain H99 labeled for polysaccharide capsule (green) and cell wall (cyan). Boxed areas are enlarged in i and ii, and are single z-sections. Scale bar is 20 µm in left image and 5 µm in i and ii. (e,f) Intracellular cryptococci have smaller polysaccharide capsules. Relative frequency histograms of capsule radius for intracellular (e) and extracellular (f) cryptococci. (g) Output of probability model using relative numbers within macrophages from (e,f) to calculate proportion of intracellular cryptococci at different inocula given random input (h) Cryptococcal capsule is enlarged and shed at 24 hpi. Fixed tissue of AB strain zebrafish infected with >102-103 C. neoformans strain H99GFP (green) at 24 hpi labeled with antibody to capsular polysaccharide (cyan). Scale bar 10 µm. Boxed areas are enlarged in i and ii. Scale bar 5 µm. (i,j) Cryptococcal capsule size greatly enlarged 24 hpi. Relative frequency histograms of capsule radius for inoculum (i) and 24 hpi (j) cryptococci isolated from AB strain zebrafish infected with >102-103 of C. neoformans strain H99. Inset panels are example India ink stained samples. Scale bar 5 µm. 615 cryptococci were measured in 12 infections from n = 3. |
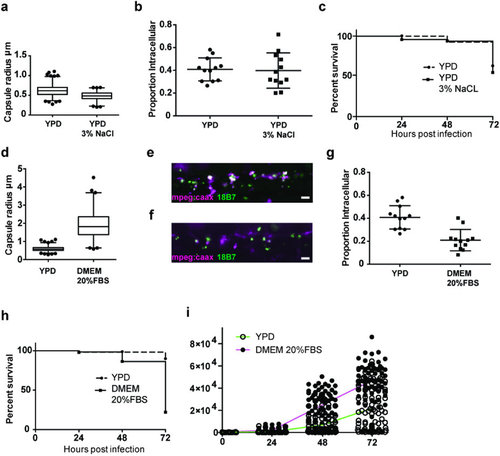
In vitro recapitulation of large polysaccharide capsule prevents macrophage phagocytosis in vivo.(a) Reduction of cryptococcal capsule in vitro. P < 0.001, Mann-Whitney; Medians YPD = 0.62 µm, YPD 3%NaCl = 0.48 µm. 632 (YPD) and 345 (YPD 3% NaCl) infections, India ink staining from n = 3. (b) Proportion of intracellular cryptococci 2 hpi of Tg(mpeg1:mCherryCAAX)sh378 with >101-102 C. neoformans strain H99GFP grown in YPD or YPD 3% NaCl. Each point represents a separate infection from n = 4 plotted with median and standard deviation. (c) Survival of AB-strain zebrafish infected with >102-103 of C. neoformans strain H99GFP grown in YPD or YPD 3% NaCl (P = 0.38, logrank (Mantel-Cox)). 55 (YPD) and 66 (YPD 3% NaCl) infections, from n = 3. (d) Induction of cryptococcal capsule in vitro. P < 0.001, Mann-Whitney, Medians YPD = 0.58 µm, DMEM 20% FBS = 1.81 µm. 513 (YPD) and 255 (DMEM 20% FBS) India ink staining from n = 3. (e,f) Example maximum intensity projection from three-dimensional fluorescence imaging of Tg(fms:Gal4.VP16)i186;Tg(UAS:nfsB.mCherry)i149 (magenta) infected with >101-102 of C. neoformans strain H99GFP (green) 2 hpi. Intracellular yeast appear white due co-localisation of both colours (e) YPD inoculum. (f) DMEM 20% FBS inoculum. (g) Proportion of intracellular cryptococci 2 hpi of Tg(mpeg1:mCherryCAAX)sh378 with >101-102 C. neoformans strain H99GFP grown in YPD or DMEM 20% FBS. Each point represents a separate infection from n = 4 with median and standard deviation. (h) Survival of AB-strain zebrafish infected with >101-102 of C. neoformans strain H99GFP grown in YPD or DMEM 20% FBS. P < 0.0001, logrank (Mantel-Cox). hazard ratio = 8.2 (logrank; 95% confidence interval 6.5, 20.0). 57 and 59 infections from YPD and DMEM 20% FBS groups respectively, from n = 3. (i) Linear comparison of quantification of fungal burden using area of fluorescent pixels from Nacre-strain zebrafish infected with between >101-102 of C. neoformans strain H99GFP grown in YPD or DMEM 20% FBS. Individual infection and mean fungal burden values with H99GFP grown in YPD (open circles and green line respectively) or H99GFP grown in DMEM 20% FBS (filled circles and magenta line respectively) treatment. Each point is a separate infection; the same 100 (YPD) or 97 (DMEM 20% FBS) infections followed over 72 hours from n = 3. Box plots are whiskers at 5 and 95 percentiles with outliers plotted. |
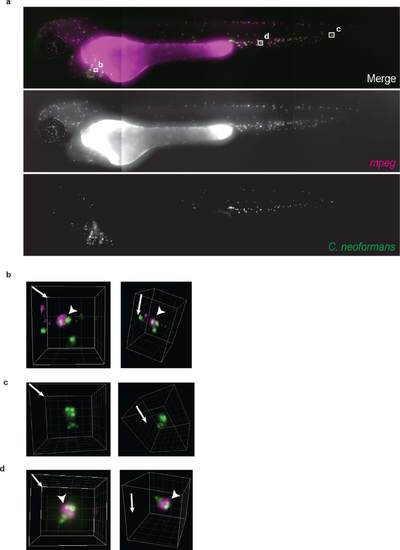
Quantification of macrophage behavior in response to Cryptococcus during infection using mpeg macrophage marker. (a) Maximum intensity z-projection of example image data from high content imaging of Tg(mpeg1:mCherryCAAX)sh378 zebrafish, with mCherry labeled macrophages (magenta), infected with 208 cells of C. neoformans strain H99GFP (green), at 2 hours post infection. (b,c,d). Areas boxed in (a) enlarged and reconstructed in three-dimensions. 42 Arrowheads indicate intracellular cryptococci. Image pairs represent different views of same volume with arrows indicating z-axis direction. Image grid is 20µm. |