
- Title
-
Estrogens Suppress a Behavioral Phenotype in Zebrafish Mutants of the Autism Risk Gene, CNTNAP2
- Authors
- Hoffman, E.J., Turner, K.J., Fernandez, J.M., Cifuentes, D., Ghosh, M., Ijaz, S., Jain, R.A., Kubo, F., Bill, B.R., Baier, H., Granato, M., Barresi, M.J., Wilson, S.W., Rihel, J., State, M.W., Giraldez, A.J.
- Source
- Full text @ Neuron
cntnap2ab Mutants Display GABAergic Deficits EXPRESSION / LABELING:
PHENOTYPE:
|
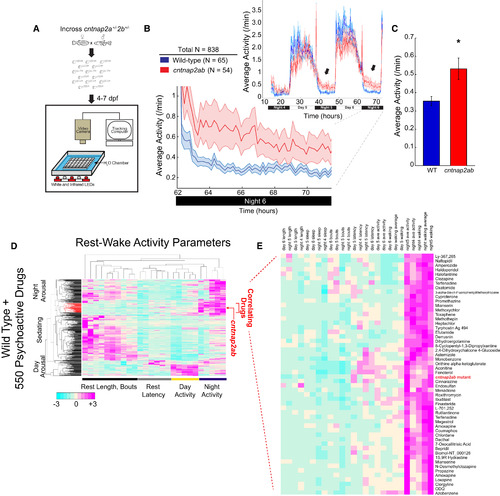
cntnap2ab Mutants Display Nighttime Hyperactivity |
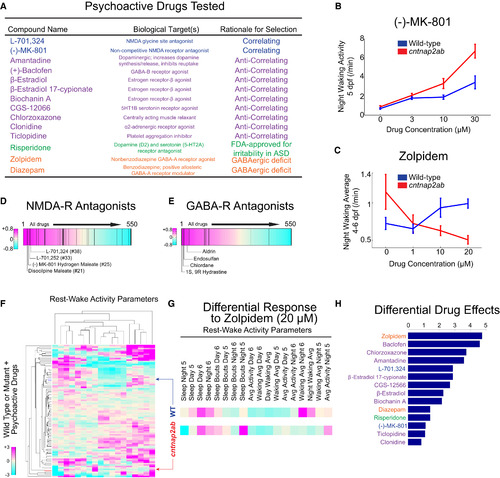
Differential Behavioral Responses of cntnap2ab Mutants to Psychoactive Agents |
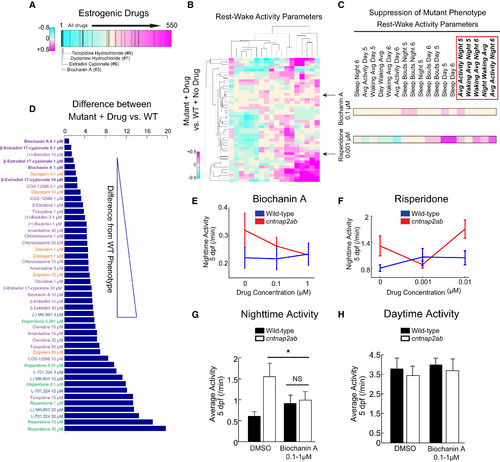
Biochanin A Reverses Nighttime Hyperactivity in cntnap2ab Mutants |
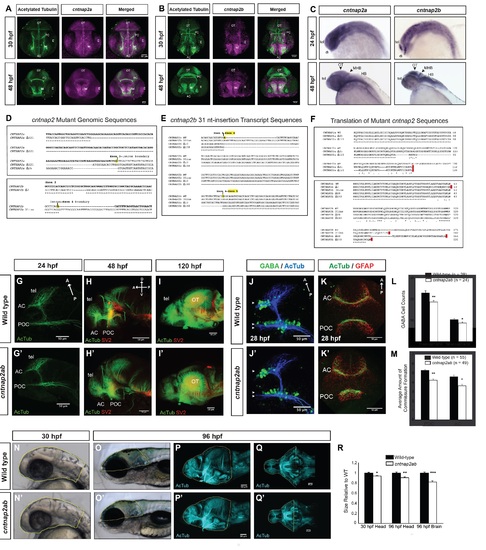
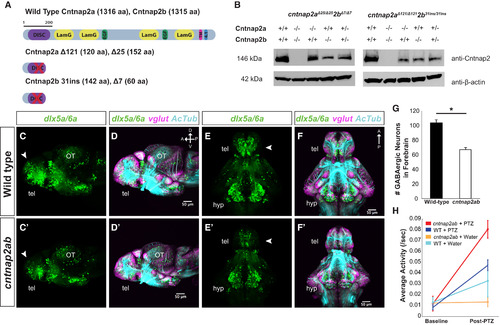
Figure S1, Related to Figure 1. Generation of cntnap2ab mutants and characterization of brain structure. A, B. Fluorescent in situ hybridization of cntnap2a and cntnap2b expression and acetylated tubulin in wild-type embryos at 30 and 48 hpf. C. Whole mount in situ hybridization of cntnap2a and cntnap2b in wild-type embryos at 24 and 48 hpf. Both paralogs are expressed in the CNS, though cntnap2b shows a more specific expression pattern in the telencephalon and diencephalon (24 hpf), the optic tectum, midbrain-hindbrain boundary, and hindbrain (48 hpf). D. Genomic sequences of insertion-deletion mutations generated by zinc finger nucleases in each cntnap2 paralog. These include Δ121 and Δ25 in exon 3 of cntnap2a (top) and Δ7 in exon 2 and a 31-nt insertion in exon 4 of cntnap2b (bottom), all of which produce a frameshift and premature stop codon. E. Alternatively spliced transcripts resulting from the 31-nt allele in exon 4 of cntnap2b identified by RT-PCR of exons 1 to 6 at 5 dpf. These transcripts include: (i) the 31-nt sequence itself, as in the genomic sequence; (ii) Δ10 in exon 4: because the 31-nt insertion occurs close to the intron-exon 4 boundary, an alternate splice site is used (the next “TCAG” in the genomic sequence after the actual intronic splice site), which is 10 nt after the beginning of exon 4; (iii) Δ148 due to splicing of the entire exon 4. All 3 transcripts produce a frameshift and a premature stop codon. We did not identify alternatively spliced transcripts resulting from the other mutations in either gene. F. Sequence alignment of wild type cntnap2a (top) and cntnap2b (bottom) proteins and the translation of mutant transcripts. All mutant transcripts are predicted to cause premature stop codons in the discoidin domains of both proteins (Figure 1A). G-I. Acetylated tubulin (AcTub) and synaptic vesicle protein 2 (SV2) labeling in wild-type (G-I) and cntnap2aΔ121/Δ121cntnap2b31i/31i (G′-I′) fish at 24, 48, and 120 hpf. While there is a transient delay in the formation of the anterior and post-optic commissures in cntnap2ab mutants at 28 hpf (see K, K′, M), these commissures form by later stages. Brain structure is not otherwise grossly disrupted in cntnap2ab mutants up to 120 hpf. J-K. Acetylated tubulin and GABA (J, J′) or GFAP (glial cells) (K, K′) in wild-type and cntnap2aΔ121/Δ121cntnap2b31i/31i (cntnap2ab) mutants at 28 hpf. L. There are significantly fewer GABA+ cells in both the telencephalon (arrowheads) and diencephalon (double arrowheads) of cntnap2ab (J′) versus wild-type (J) larvae at 28 hpf. GABA+ cells were counted in z-stack images by three blinded raters. (*p=0.00782, telencephalon; **p=0.0181, diencephalon, two-way ANOVA, genotype factor). M. The formation of the anterior commissure (AC) and post-optic commissure (POC) is delayed in cntnap2aΔ121/Δ121cntnap2b31i/31i (cntnap2ab) (K′) compared to wild-type (K) larvae (*p=0.00428, AC; **p=0.0159, POC, two-way ANOVA, genotype factor.) Three blinded raters quantified the degree of commissure formation based on a qualitative rating scale ranging from no axons crossing (1) to complete formation (7), as previously described (Barresi et al., 2005). The POC appears to be less fasciculated in mutants. Glial bridge formation is largely intact. N-R Head and brain size in wild-type (N-Q) and cntnap2aΔ121/Δ121cntnap2b31i/31i (cntnap2ab) (N′-Q′). Representative tracings done in Fiji are shown in yellow. The posterior boundaries of the head and brain were defined by the otic vesicle and the midbrain-hindbrain boundary, respectively. R. cntnap2ab mutant heads are 6.5% and 9.7% smaller than wild-type at 30 hpf and 96 hpf, respectively, and mutant brains are 18% smaller than wild-type at 96 hpf. (*p=9.71x10⁻⁷, 30 hpf head size; **p=0.00513, 96 hpf head size; ***p=3.89x10⁻⁶, 96 hpf brain size; one-way ANOVA). In addition, eye and yolk size measurements indicate that mutant fish are smaller overall (Table S1). (A, B): frontal views; (C, N-O, N′-O′): lateral views; (G-J, G′-J′, P-P′): lateral views of dissected embryos with the eye removed; (K-K′): frontal views of the forebrain; (Q-Q′): ventral views; tel, telencephalon; di, diencephalon; OT, optic tectum; PC, posterior commissure; AC, anterior commissure; POC, post-optic commissure; E, eye; MHB, midbrain-hindbrain boundary; HB, hindbrain. |
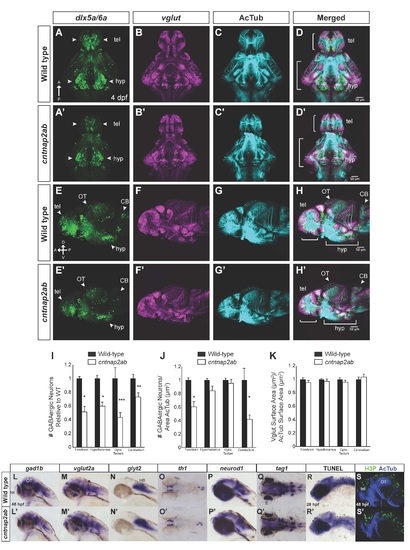
Related to Figure 1. Inhibitory and excitatory neurons in cntnap2ab mutants. Immunostainings of reporter gene expression in Tg(dlx6a-1.4kbdlx5a/dlx6a:GFP) and Tg(vglut:DsRed) in wild-type (A-H) and cntnap2aΔ121/Δ121cntnap2b31i/31i (A′-H′) larvae at 4 dpf. (A-A′, E-E′): The deficit in GABAergic neurons and precursors (dlx5a6a:GFP+ cells) is evident in the ventral and dorsal telencephalon (tel), hypothalamus (hyp), and cerebellum (CB) (arrowheads in A-A′, E-E′). The reduction in GABAergic neurons by surface area of acetylated tubulin is significant in the forebrain and cerebellum (J). I-K. dlx5a6a:GFP+ cells, vglut:DsRed and acetylated tubulin stainings were quantified by brain region at 4 dpf: forebrain (small brackets in D-D′, H-H′); hypothalamus (large brackets in D-D′, H-H′); cerebellum (arrowheads in E-E′, H-H′); and optic tectum (arrowheads in E-E′, H-H′). (forebrain and hypothalamus: wild-type, n=9; cntnap2ab, n=9; optic tectum and cerebellum: wild-type, n=7; cntnap2ab, n=8) I. dlx5a6a:GFP+ cell number normalized to wild-type. (*p<0.001; **p<0.01; ***p<0.02; one-way ANOVA, Bonferroni corrected). J. dlx5a6a:GFP+ cell number relative to acetylated tubulin surface area normalized to wild-type. Because there are significant reductions in GABAergic neurons relative to area in the forebrain and cerebellum, we concluded that the GABAergic deficits in these regions are not primarily attributable to the reduction in brain size. (*p<0.02; one-way ANOVA, Bonferroni corrected). K. vglut:DsRed surface area relative to acetylated tubulin surface area normalized to wild-type. Unlike GABAergic neurons, there are no significant reductions in glutamatergic surface area relative to acetylated tubulin surface area across regions, suggesting these differences are due to the overall reduction in brain size as opposed to regional deficits (p=0.225, forebrain; p=0.444, hypothalamus; p=0.408, optic tectum; p=0.490, cerebellum; one-way ANOVA). L-S. Analysis of the CNS of wild-type (L-S) and cntnap2aΔ121/Δ121cntnap2b31i/31i (cntnap2ab) (L′-S′) by in situ hybridization at 48 hpf: (L, L′): glutamate decarboxylase 1b (gad1b); (M, M′): vesicular glutamate transporter or solute carrier family 17, member 6b (vglut2a or slc17a6b); (N, N′): solute carrier family 6 (neurotransmitter transporter, glycine), member 5 (glyt2 or slc6a5); (O, O′): tyrosine hydroxylase (th1 or th); (P, P′): neuronal differentiation 1 (neurod or neurod1); (Q, Q′); transiently expressed axonal glycoprotein (tag1) or contactin 2 (cntn2); (R, R′): TUNEL staining at 28 hpf; (S, S′): phospho-histone H3 (H3P) (green) and acetylated tubulin (blue) immunostaining at 48 hpf. We observed that expression of gad1b was variable. No gross differences in the other neurotransmitter systems, markers of neuronal differentiation, apoptosis, or cell proliferation were observed. (A-D, A′-D′, E-H, E′-H′) show all channels for the images in Figure 1C-F and 1C′-F′, respectively. (A-D, A′-D′): ventral views; (E-H, E′-H′, L-N, L′-N′; P-P′, R-R′, S-S′):): lateral views; (O-O′, Q-Q′): dorsal views. (tel, telencephalon; hyp, hypothalamus; OT, optic tectum; CB: cerebellum; HB, hindbrain; E, eye.) |