
- Title
-
Epigenetic regulation of hematopoiesis by DNA methylation
- Authors
- Gore, A.V., Athans, B., Iben, J.R., Johnson, K., Russanova, V., Castranova, D., Pham, V.N., Butler, M.G., Williams-Simons, L., Nichols, J.T., Bresciani, E., Feldman, B., Kimmel, C.B., Liu, P.P., Weinstein, B.M.
- Source
- Full text @ Elife
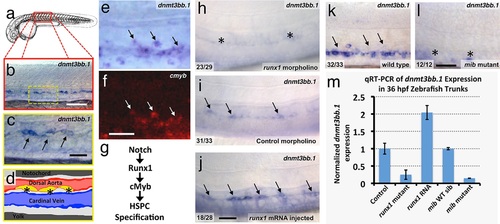
The DNA methyltransferase3bb.1 gene is expressed in developing hematopoietic stem and progenitor cells and is regulated by hematopoietic stem and progenitor cell ( HSPC)-specific pathways. (a) Camera lucida drawing of a 24 hpf zebrafish embryo with a red box noting the approximate region of the trunk shown in in situ hybridization images. (b,c) Whole-mount in situ hybridization of a 36 hpf zebrafish trunk probed for dnmt3bb.1, showing expression in the ventral floor of the dorsal aorta (arrows in panel c). Yellow inset box in panel b indicates the magnified area shown in panel c. (d) Diagram corresponding to panel c showing dorsal aorta (red), cardinal vein (blue), and dnmt-positive cells in the floor of the dorsal aorta (yellow). (e,f) Double in situ hybridization of a 36 hpf zebrafish trunk probed for dnmt3bb.1 (e, blue) and c-myb (f, red). The c-myb positive HSPC progenitors also stain for dnmt3bb.1 (arrows). (g) A Notch- Runx- c-myb pathway regulates HSPC emergence in the zebrafish. (h-j) In situ hybridization of 36 hpf runx1 morpholino-injected (h), control (i), or runx1 mRNA-injected (j) zebrafish trunks probed for dnmt3bb.1, showing that dnmt3bb.1 expression is reduced by runx1 knockdown (asterisks) and increased by runx1 overexpression (arrows). (k,l) In situ hybridization of 36 hpf wild type (k) or mind bomb mutant (l) zebrafish trunks probed for dnmt3bb.1, showing that dnmt3bb.1 expression seen in wild-type siblings (arrows in panel k) is strongly reduced in Notch-deficient mind bomb mutants (asterisks in panel l). (m) Quantitative reverse transcriptase-polymerase chain reaction (qRT-PCR) analysis of dnmt3bb.1 transcript levels in 36 hpf (i) control, (ii) runx1W84X mutant, (iii) runx1 mRNA injected, (iv) mind bomb (mib) wild type sibling (wild type sibling of mib mutants), and (v) mib mutant zebrafish embryos. dnmt3bb.1 levels are normalized to the reference gene elf1α and to levels in controls. All graphs show mean ± standard error of the mean (SEM) and are representative of three biological replicates. Scale bars = 100 µm in b, h-l and 50 µm in c, f. |
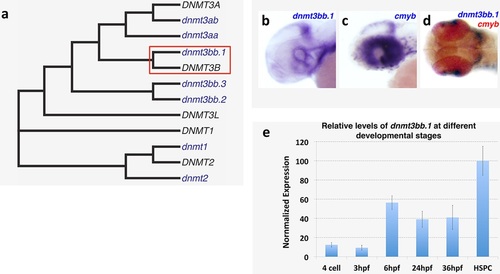
Dnmt3bb.1expression analysis and homology. (a) Phylogenetic tree showing zebrafish Dnmt3bb.1 is the closest homolog of human DNMT3B. (b-d) WISH showing non-hematopoietic expression of dnmt3bb.1, b, cmyb, c, and dnmt3bb.1 and cmyb, d, in the heads of 36 hpf zebrafish. (e) relative levels of dnmt3bb.1 in embryos at different developmental stages. |
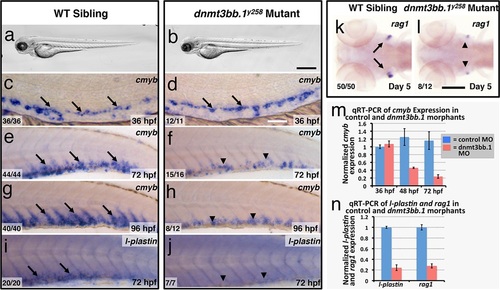
Dnmt3bb.1is necessary for hematopoietic gene expression. (a,b) Transmitted light images of 72 hpf control (a) and dnmt3bb.1y258 (b) mutant zebrafish, showing absence of developmental delay or gross morphological abnormalities in dnmt3bb.1y258 mutants. (c-h) Whole mount in situ hybridization of 36 hpf (c,d), 72 hpf (e,f) and 96 hpf (g,h) wild type (WT) sibling (c,e,g) or dnmt3bb.1y258 (d,f,h) mutant animals, probed for cmyb. Cmyb is expressed in dnmt3bb.1 mutant at 36 hpf (arrows) but this expression is strongly reduced by 72 and 96 hpf (arrowheads). (i-l) Whole mount in situ hybridization of 72 hpf tails probed for l-plastin (i,j) and 5 dpf heads probed for rag1 (k,l) from WT sibling (i,k) or dnmt3bb.1 (j,l) mutant animals. Expression of both l-plastin and rag1 is present in controls (arrows) but strongly reduced in dnmt3bb.1 mutant animals (arrowheads). (m) Quantitative RT-PCR analysis of cmyb transcript levels in control (blue columns) or dnmt3bb.1 (red columns) morpholino injected animals at 36, 48, and 72 hpf. Transcript levels are normalized to the reference gene elf1α and to levels in 36 hpf control morphants. (n) Quantitative RT-PCR analysis of 3 dpf l-plastin and 5 dpf rag1transcript levels in control (blue columns) or dnmt3bb.1 (red columns) morpholino-injected animals. Transcript levels are normalized to the reference gene elf1α and to levels in controls. All graphs in panels i and j show mean ± SEM, are representative of three biological replicates. Scale bars = 150 µm in a,b, 50 µm in c,d, 100 µm in e-l. |
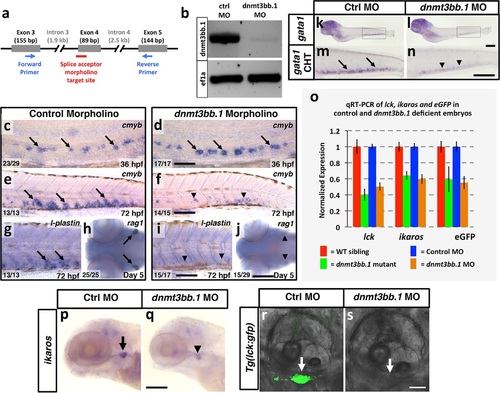
Dnmt3bb.1 morpholino phenocopies TALEN-induced mutant defects. (a) Schematic diagram showing the splice acceptor morpholino target site at the dnmt3bb.1 intron 3-Exon 4 boundary (red line) and positions of primers used to detect splicing changes (blue arrows). (b) RT-PCR gel image showing loss of correctly spliced dnmt3bb.1 transcripts in splice acceptor morpholino-injected animals. (c-f) WISH of 36 hpf trunks (c,d) and 72 hpf tails (e,f) from control (c,e) and dnmt3bb.1 (d,f) morpholino injected animals, probed for cmyb. cmyb is expressed in dnmt3bb.1 morphants at 36 hpf (arrows) but the expression is lost by 72 hpf (arrowheads). (g-j) WISH of 72 hpf tails probed for l-plastin (g,i) and 5 dpf heads probed for rag1 (h,j) from control (g,h) or dnmt3bb.1 (i,j) morpholino-injected animals. (k-n) WISH of 5 dpf embryos probed for gata1 expression in control (k,m) and dnmt3bb.1 (l,n) morpholino injected embryos. m,n, higher magnification images of highlighted areas from k,l. (o) Quantitative RT-PCR analysis at 5 dpf lck, ikaros and eGFPtranscript levels in WT siblings (red columns), dnmt3bb.1 mutants (green columsn), control morpholino (blue columns) or dnmt3bb.1 (yellow columns) morpholino-injected animals. Transcript levels are normalized to the reference gene elf1α and to levels in controls. (p,q) WISH of 5 dpf embryos probed for ikaros expression in control (p) and dnmt3bb.1 (q) morpholino injected embryos. Expression of l-plastin, rag1, gata1 and ikaros is present in controls (arrows) but reduced in dnmt3bb.1 morpholino-injected animals (arrowheads). (r,s) Confocal images of 5 dpf Tg(lck:gfp) embryos injected with control (q) or dnmt3bb.1 morpholinos. Scale bars 50 µm in d, 100 µm in f,i,j,n,p, 25 µm in r. |
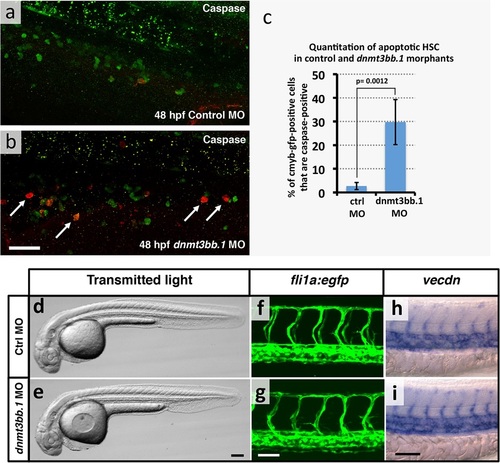
HSPCapoptosis but no gross morphological and vascular defects in in dnmt3bb.1 morphants. (a,b) Immunohistochemical staining of the trunks of 48 hpf control (a) and dnmt3bb.1 (b) morpholino-injected Tg(cmyb:gfp) transgenic zebrafish with anti-GFP (green) and anti-caspase3 (red) antibodies, showing increased numbers of caspase3-positive HSPC in dnmt3bb.1-deficient animals. (c) Quantitation of the percentage of GFP (cmyb) positive HSPCs that are also caspase3-positive in 48 hpf control or dnmt3bb.1 morpholino-injected Tg(cmyb:gfp) transgenic zebrafish. Columns show mean ± SEM, and statistical significance calculated by paired t-test is shown (p = 0.0012). (d,e) Transmitted light images of whole 36 hpf control (d) and dnmt3bb.1 (e) morpholino-injected zebrafish, showing absence of developmental delay or gross morphological abnormalities in dnmt3bb.1 morphants. (f,g) Confocal images of trunk EGFP fluorescence in 36 hpf control (f) or dnmt3bb.1 (g) morpholino-injected Tg(fli1a:egfp)y1 transgenic zebrafish, showing normal trunk vessel patterning in dnmt3bb.1 morphants. (h,i) Whole mount in situ hybridization of the trunks of 36 hpf control (h) or dnmt3bb.1 (i) morpholino-injected zebrafish probed for vecdn, showing normal expression in dnmt3bb.1 morphants. All images are lateral views, rostral to the left. Scale bars 25 µm in b, 100 µm in e and 50 µm in g,i. PHENOTYPE:
|

ZFIN is incorporating published figure images and captions as part of an ongoing project. Figures from some publications have not yet been curated, or are not available for display because of copyright restrictions. |
|
ZFIN is incorporating published figure images and captions as part of an ongoing project. Figures from some publications have not yet been curated, or are not available for display because of copyright restrictions. |
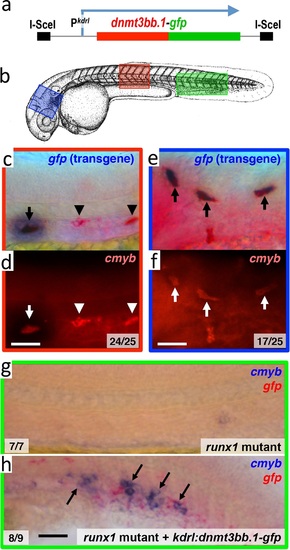
Dnmt3bb.1is sufficient for cmyb gene expression in the endothelium. (a) Schematic diagram of the I-Sce1(kdrl:dnmt3bb.1-gfp) transgene used for the pan-endothelial expression of a dnmt3bb.1-gfp fusion protein. (b) Camera lucida drawing of a 24 hpf zebrafish embryo with red, blue and green boxes noting the approximate regions of the head, trunk and trunk/tail shown in in situ hybridization images in panels c-h. (c,e) Double whole-mount in situ hybridization of the head (e) and trunk (c) of 36 hpf I-Sce1(kdrl:dnmt3bb.1-gfp) transgene-injected zebrafish probed for gfp (blue) and cmyb (red). (d,f) fluorescence images of in situ hybridization corresponding to panels c and e, respectively. In panels c-e, endothelial cells expressing both the gfp transgene and cmyb are noted with arrows, while normal trunk HSC expressing only cmyb but not gfp are noted with arrowheads. (g,h) Double whole-mount in situ hybridization of the trunk/tail of a 36 hpf runx1 mutant (g) and a 36 hpf runx1 mutant injected with I-Sce1(kdrl:dnmt3bb.1-gfp) transgene (h), probed for cmyb (blue) and gfp (red). The cmyb gene is not expressed in runx1 mutants, but injection of dnmt3bb.1-egfp fusion protein into runx1 mutants results in the appearance of cmyb/gfp double-positive cells. Scale bars 25 µm in e,f and 100 µm in h. |
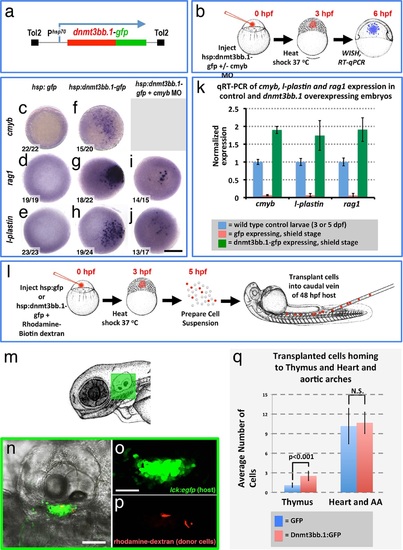
Dnmt3bb.1is sufficient for HSPC and downstream lineage gene expression. (a) Schematic diagram of the Tol2(hsp70:dnmt3bb.1-gfp) transgene used for ubiquitous heat shock-inducible expression of dnmt3bb.1-gfp fusion protein. (b) Camera lucida drawing showing the experimental protocol employed for early embryonic induction of dnmt3bb.1. One cell-stage embryos are injected with Tol2(hsp70:dnmt3bb.1-gfp) transgene +/- cmyb morpholino (MO), raised to 3 hpf (mid-blastula stage), heat shocked, allowed to further develop to 6 hpf (shield stage), then either fixed for whole mount in situ hybridization (WISH) or collected to prepare RNA for RT-qPCR. (c-j) Whole mount in situ hybridization of 6 hpf control Tol2(hsp70:gfp) transgene-injected (c-e), Tol2(hsp70:dnmt3bb.1-gfp) transgene-injected (f-j), or Tol2(hsp70:dnmt3bb.1-gfp) transgene plus cmyb morpholino (MO)-injected (i,j) zebrafish embryos, probed for cmyb (c,f), rag1 (d,g,i), or l-plastin (e,h,j). (k) Quantitative RT-PCR analysis of cmyb, l-plastin, and rag1transcript levels in positive control untreated 3 dpf (for cmyb and l-plastin) or 5 dpf (for rag1) larvae (blue columns), negative control shield stage (6 hpf) embryos injected with a Tol2(hsp70:egfp) transgene and heat shocked at 3 hpf (red columns), or shield stage (6 hpf) embryos injected with an Tol2(hsp70:dnmt3bb.1-egfp) transgene and heat shocked at 3 hpf (green columns). (l) Schematic drawing showing the experimental protocol employed for early embryonic induction of dnmt3bb.1-gfp and subsequent transplantation of cells into the circulation. One cell-stage embryos were injected with Tol2(hsp70:egfp) or Tol2(hsp70:dnmt3bb.1-egfp) transgenes, raised to 3 hpf (mid-blastula stage), heat shocked, and allowed to develop to 5 hpf, at which point the embryos were dissociated and cell suspensions was prepared. Dissociated cells were injected into the circulation of 48 hpf host larvae using a borosilicate needle without filament. (m) Camera lucida drawing of a 72 hpf zebrafish embryo with a green box noting the approximate regions containing the thymus. (n-p) Confocal images of a 5 dpf Tg(lck:GFP)cz1 host animal showing transplanted cells colonizing the thymus. Transmitted light image (n), green fluorescent lck:gfp positive host thymus (n,o), and red fluorescent rhodamine-dextran positive donor cells populating the thymus (p). (q) Quantitation of the number of control GFP and dnmt3bb.1-GFP expressing cells in the thymus and heart/aortic arch region. Images in panels c-f,r,s are dorsal views and panels n-p are lateral views. Scale bars = 150 µm in c-j, 25 µm in n, 10 µm in o. |
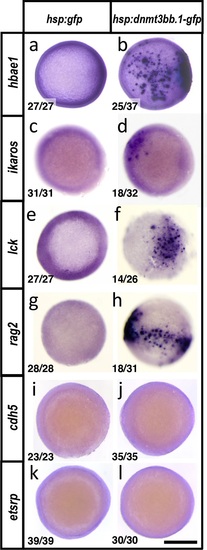
Dnmt3bb.1induces hematopoietic but not endothelial gene expression in early embryos. (a-l) Whole mount in situ hybridization of 6 hpf control Tol2(hsp70:gfp) (a,c,e,g,i,k) or Tol2(hsp70:dnmt3bb.1-gfp) (b,d,f,h,j,l) transgene-injected zebrafish embryos, probed for hbae1 (a,b), ikaros (c,d), lck (e,f), rag2 (g,h), cdh5 (i,j) and etsrp (k,l) All panels show animal pole views. Scale bar 150 µm in l. |
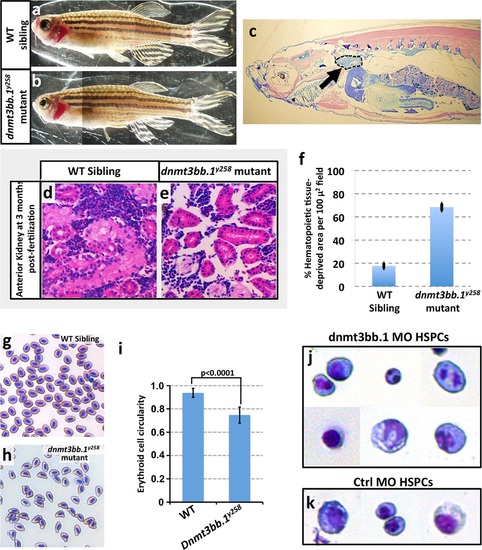
Hematopoieticdefects in adult dnmt3bb.1y258 Mutants. (a,b) Wild type sibling (a) and dnmt3bb.1y258homozygous mutant (b) adult zebrafish. (c) Representative low-magnification sagittal section through a dnmt3bb.1y258 homozygous mutant adult zebrafish, showing the head kidney (marked an arrow and surrounded by a dashed line), a major site of hematopoiesis in adult zebrafish. (d,e) Representative higher magnification images of sagittal sections through the head kidneys of wild type sibling (d) and dnmt3bb.1y258 mutant (e) adult zebrafish, stained with hematoxylin/eosin. (f) quantitation of the percentage of the hematopoietic (non-kidney tubule) area that is acellular in head kidney sections from wild type sibling (left column) and dnmt3bb.1y258 mutant (right column) adult zebrafish. (g,h) Giemsa -stained blood smears from wild type sibling (g) and dnmt3bb.1y258 mutant (h) adult zebrafish. (i) quantitation of the adult erythroid cell circularity in WT and dnmt3bb.1y258 mutant (see Materials and methods), measured from blood smears such as those in panels g and h. (j,k) Giemsa stained FACS-sorted HSPC (as in Figure 3a) from 36 hpf dnmt3bb.1 (j) or control (k) morpholino-injected zebrafish. |
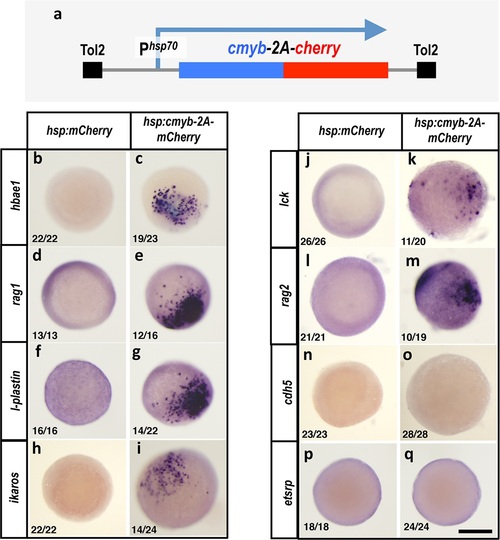
Cmybinduces hematopoietic but not endothelial gene expression in early embryos. (a) Schematic diagram of the Tol2(hsp70:cmyb-2A-mCherry) transgene used for ubiquitous heat shock-inducible expression of cmyb. (b-q) WISH of 6 hpf control Tol2(hsp70:mCherry) (b,d,f,h,j,l,n,p) or Tol2(hsp70:cmyb-2A-mCherry) (c,e,g,i,k,m,o,q) transgene-injected zebrafish embryos, probed for hbae1 (b,c), rag1 (d,e), l-plastin (f,g), ikaros (h,i), lck (j,k), rag2 (l,m), cdh5 (n,o), and etsrp (p,q) All panels show animal pole views. Scale bar 150 µm in q. |