
- Title
-
Imaging tumour cell heterogeneity following cell transplantation into optically clear immune-deficient zebrafish
- Authors
- Tang, Q., Moore, J.C., Ignatius, M.S., Tenente, I.M., Hayes, M.N., Garcia, E.G., Torres Yordán, N., Bourque, C., He, S., Blackburn, J.S., Look, A.T., Houvras, Y., Langenau, D.M.
- Source
- Full text @ Nat. Commun.
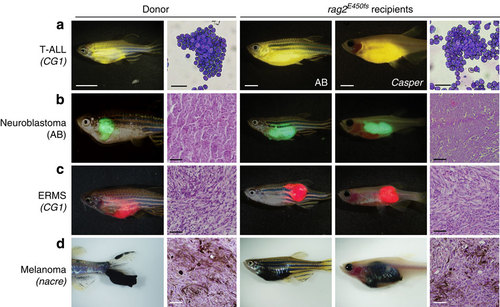
Zebrafish cancers engraft into homozygous rag2E450fs (casper) animals. Donor animals shown in the left two panels while transplant recipients are to the right. (a) ZsYellow-labelled Myc-driven T-ALL from the syngeneic CG1 background, (b) EGFP-labelled neuroblastoma from AB background, (c) mCherry-labelled kRASG12D-driven ERMS from CG1 background, and (d) BRAFV600E-induced melanoma arising in tp53-/-nacre background. Tumour cells were transplanted intra-peritoneally (a,b,d) or intra-muscularly (c) into both rag2E450fs (AB) and rag2E450fs (casper)-recipient fish. Merged brightfield and fluorescent images are shown at 30 d.p.t. Cytospins of leukaemia cells are shown in a, whereas haematoxylin and eosin (H&E)-stained sections are shown in b-d. Scale bars equal 5 mm in whole animals images, 20 µm for cytospins shown in a, and 50 µm for histology sections shown in b-d. PHENOTYPE:
|
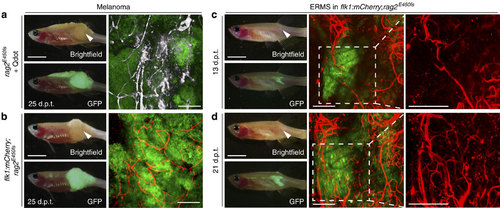
Imaging neovascularization in rag2E450fs (casper) zebrafish engrafted with fluorescently labelled melanoma and ERMS. (a) GFP-labelled, amelanotic melanoma implanted into rag2E450fs (casper) fish (n=8 animals) and imaged following intravascular injection of crimson quantum dots (Qtracker 655). Whole animal images to the left and confocal images to the right ( × 100 magnification, 100-200 µm z-stack). Quantum dot fluorescence has been pseudo-coloured white. (b) GFP-labelled, amelanotic melanoma implanted into flk1:mCherry; rag2E450fs (casper) transgenic zebrafish (n=4 animals). (c-d) GFP-labelled ERMS engrafted into flk1:mCherry; rag2E450fs (casper) transgenic zebrafish (n=5 animals) and serially imaged over time (c, 13 d.p.t. and d, 21 d.p.t.). White arrowheads denote the site of intra-muscular injection of tumour cells. Scale bars equal 5 mm in whole animal images and 200 µm in confocal images. EXPRESSION / LABELING:
PHENOTYPE:
|
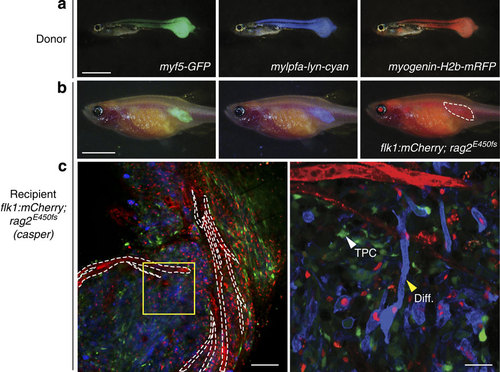
Resolving tumour cell heterogeneity in ERMS at single-cell resolution following engraftment into flk1:mCherry; rag2E450fs (casper) zebrafish. (a) Epi-fluorescent images of primary ERMS in a 32-day-old myf5:GFP; myogenin-H2b:mRFP; mylpfa:lyn-cyan triple transgenic zebrafish. (b) Epi-fluorescent images of flk1:mCherry; rag2E450fs (casper)-recipient fish engrafted intra-muscularly with fluorescently labelled ERMS at 28 d.p.t. (n=4 animals). (c) Confocal image with mCherry-labelled vasculature outlined by white dashed lines (left, × 100 magnification). Higher magnification of boxed region (right, × 400 magnification). Myosin-expressing, differentiated cells (Diff.) and less frequent myf5-GFP+ tumour-propagating cell (TPC) denoted by arrowheads. Scale bar equals 2 mm in a, 5 mm in b, 100 µm (c, left panel) and 25 µm (c, right panel). |
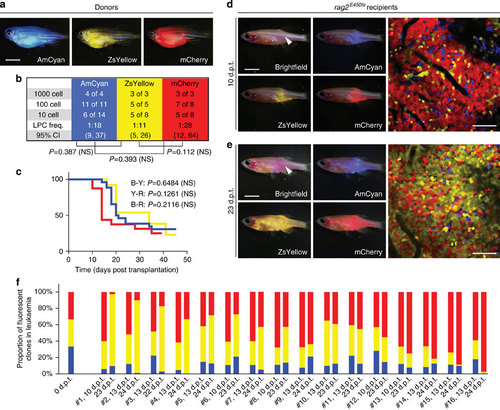
Visualizing the emergence of clonal dominance in Myc-induced T-ALL. (a) Donor animals engrafted with monoclonal T-ALL arising in the CG1 background. (b,c) Monoclonal T-ALLs were implanted into the syngeneic CG1 strain fish and assessed for LPC frequency by limiting dilution cell transplantation (b) or latency of regrowth (c). P-values are noted within each panel. Not significant (NS). (d,e) Confocal imaging of engrafted rag2E450fs (casper) fish at 10 d.p.t. (d) and 23 d.p.t. (e). White arrow denotes site of injection, and the location for confocal imaging. (f) Relative proportions of each fluorescent clone contained within leukaemias from individual engrafted animals (n=16 animals). Imaging was completed on the same animals at 10-13 d.p.t. and 22-24 d.p.t. The ZsYellow+ clone dominates leukaemia regrowth in animals #1-3, whereas mCherry+ dominates in animals #13-16. Scale bars equal 5 mm in whole animal images and 50 µm in confocal images. PHENOTYPE:
|
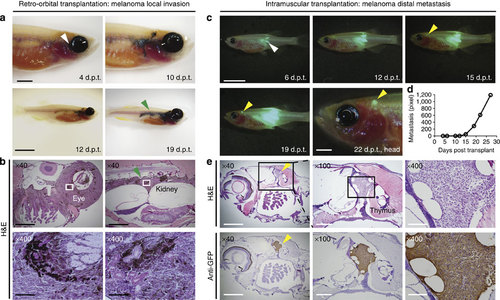
Visualizing melanoma invasion and metastasis following engraftment into rag2E450fs (casper) (casper) mutant fish. (a) Invasion assays using retro-orbital transplantation of a BRAFV600E, tp53-/- pigmented melanoma. White arrow denotes the site of injection. Green arrow denotes spread to the kidney marrow that is contiguous with primary tumour growth that has arisen adjacent to the eye. Histological examination confirmed the presence of pigmented melanoma cells at the site of injection (b, left panels) and contiguous with the trunk kidney (b, right panels). (c) Metastasis assays using implantation of non-pigmented, GFP-labelled melanoma cells into the dorsal musculature of rag2E450fs (casper)-recipient fish. White arrow denotes the site of injection. Yellow arrow denotes site of distal metastasis. (d) Quantification of metastatic growth as assessed by epi-fluorescence microscopy over time. (e) Haematoxylin and eosin-stained sections of the same animal imaged in c, confirming metastatic growth of melanoma adjacent to the thymus (top panels) and confirmed by anti-GFP immunostaining on section (bottom panels). Scale bars equal 5 mm for whole animal images, 2 mm in images of heads, 1 mm in × 40 histological images; 300 µm in × 100 histological images and 100 µm in × 400 histological images. PHENOTYPE:
|
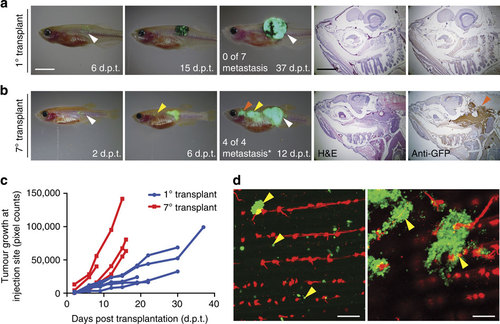
Assessing metastatic potential and the functional consequences of tumour evolution in melanoma. (a,b) Serial imaging of engrafted GFP-labelled melanoma implanted into adult rag2E450fs (capser) mutant fish. The 1° transplant was pigmented (a), whereas the 7° transplanted melanoma had lost pigmentation (b). Number of animals with metastatic growth is noted (*P=0.003, Fisher’s exact test comparing 1° and 7° transplant). White arrow indicates the site of injection. Yellow and red arrows denote sites of distal metastases. Histological staining (H&E and anti-GFP) of distal metastasis is shown in the right panels. (c) Quantification of tumour growth at the site of initial engraftment over time. (d) Confocal imaging of micro-metastatic lesions found adjacent to the tail vasculature of flk1:mCherry; rag2E450fs (casper)-recipient fish engrafted with 7° transplant melanoma. Yellow arrows denote micro-metastatic lesions. Scale bars equal 5 mm for whole animal images in a,b, 2 mm for histology shown in a,b and 200 µm in d. |
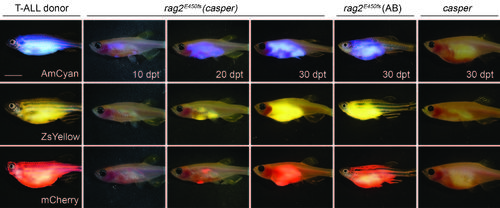
Imaging T-ALL progression and growth in transplanted rag2E450fs (casper) fish. Monoclonal T-ALLs were serially passaged in CG1 strain fish and then used as donors (left panel). Cells were transplanted intra-peritoneally into rag2E450fs (casper), rag2E450fs (AB), and unconditioned, casper-strain recipient fish (1.0x10⁵ cells per recipient animal). Merged brightfield and fluorescent images are shown at 10, 20 and 30 dpt. Scale bars equal 5 mm. |
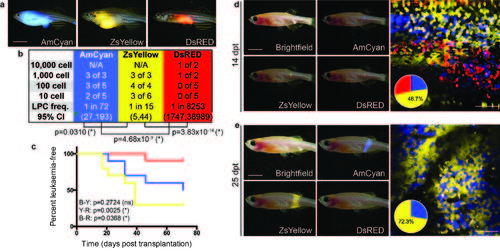
Emergence of clonal dominance can result from inherent functional differences between T-ALL clones. (a) Donor animals engrafted with monoclonal T-ALL arising in the CG1 background. (b-c) Monoclonal T-ALLs were implanted into syngeneic CG1 strain fish and assessed for LPC frequency by limiting dilution cell transplantation (b) or latency of regrowth (c). T-ALLs have significantly different LPC frequency and latency, with p-values noted on each panel. (d-e) Confocal imaging of engrafted rag2E450fs (casper) fish at 14 dpt (d) and 25 dpt (e). White arrow denotes site of injection and imaging. Pie chart shows the relative proportion of each fluorescent clone contained within the imaging panel shown. Scale bars equal 5 mm in whole animal images and 50 µm in confocal images. |
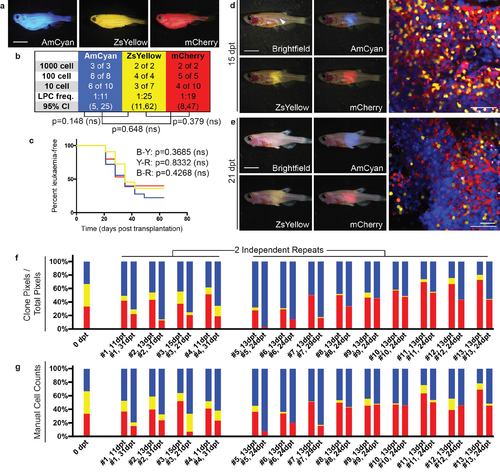
Emergence of clonal dominance among three similar TALL clones. (a) Donor animals engrafted with monoclonal T-ALL arising in the CG1 background. (b-c) Monoclonal T-ALLs were implanted into syngeneic CG1 strain fish and assessed for LPC frequency by limiting dilution cell transplantation (b) or latency of regrowth (c). T-ALLs have similar LPC frequency and latency, with p-values noted on each panel. (d-e) Confocal imaging of engrafted rag2E450fs (casper) fish at 15 dpt (d) and 21 dpt (e). White arrow denotes site of injection and imaging. (f-g) Relative proportions of each fluorescent clone contained within individual engrafted animals quantified by fluorescence area within confocal images (f) and manual cell counts (g). Scale bars equal 5 mm in whole animal images and 50 µm in confocal images. |
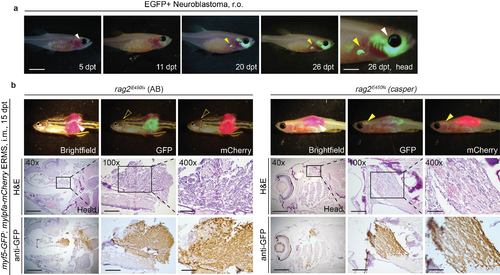
Visualising neuroblastoma and ERMS metastasis in transplanted rag2E450fs (casper) fish. (a) Retro-orbital transplantation of a GFP-labelled neuroblastoma. White arrow indicates the site of injection; yellow arrow indicates metastasis to a region near the liver. (b) Intra-muscular transplantation of ERMS into rag2E450fs recipient fish. White arrow indicates the site of injection; yellow arrows indicate the site of metastasis. Note that metastasis can be directly visualised by epifluorescence microscopy in the rag2E450fs (casper) recipients (yellow arrow) but not the rag2E450fs (AB) (open yellow arrow). H&E and anti-GFP staining on sections of the recipient animals confirmed the location of metastasis. Scale bars equal 5 mm for whole animal images, 2 mm in images of heads, 1 mm in 40x histological images; 300 µm in 100x histological images; and 100 µm in 400x histological images. |
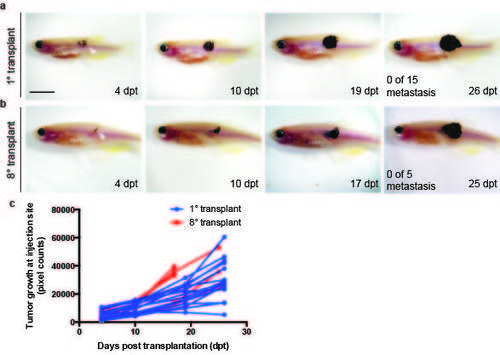
Serial passaging did not result in increased metastatic potential or growth in one melanoma. (a-b) Serial imaging of engraftment of a pigmented melanoma into rag2E450fs (casper) recipient fish. 1° transplant (a) and 8° transplant (b). White arrow indicates the site of injection. (c) Quantification of tumour growth within individual engrafted fish. Scale bar equals 5 mm. |