
- Title
-
Long-distance communication by specialized cellular projections during pigment pattern development and evolution
- Authors
- Eom, D.S., Bain, E.J., Patterson, L.B., Grout, M.E., Parichy, D.M.
- Source
- Full text @ Elife
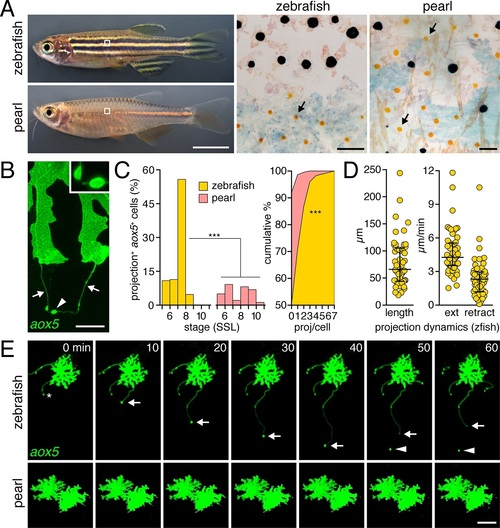
Pigment cell projections. (A) Zebrafish and pearl danio. Right, melanophores and xanthophores (arrows) after epinephrine treatment to contract pigment granules. (B) Long projections by zebrafish aox5+ cells of xanthophore lineage (arrows) with membraneous vesicles (arrowhead, inset). (C) Zebrafish aox5+ cells were more likely to extend projections than pearl, especially during early stripe development [7–8 SSL (Parichy et al., 2009); species x stage, χ2=103.4, d.f.=4, p<0.0001; N=929, 1259 cells for zebrafish and pearl; projections per cell: χ2=45.3, d.f.=1, p<0.0001]. (D) In zebrafish, projections were often long and fast. Bars indicate median ± interquartile range (IQR). (E) Extension and retraction (arrow) and release of vesicle (arrowhead) in zebrafish but not pearl. Scale bars: 5 mm (A, left); 50 µm (A, right); 10 µm (B); 50 µm (E). EXPRESSION / LABELING:
|
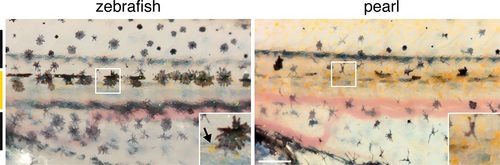
Developing adult pigment patterns during peak stages of aox5+ fast projections in zebrafish. In zebrafish (7.5 SSL), melanophores are found along the horizontal myoseptum (e.g., outline and inset) and an interstripe region with pigmented xanthophores (inset, arrow) has started to develop. Vertical bars at left indicate approximate locations of stripes (black) and interstripes (orange). In pearl, fewer melanophores are present, the developing interstripe is indistinct and xanthophores have differentiated widely across the flank. Scale bar: 200 µm. |
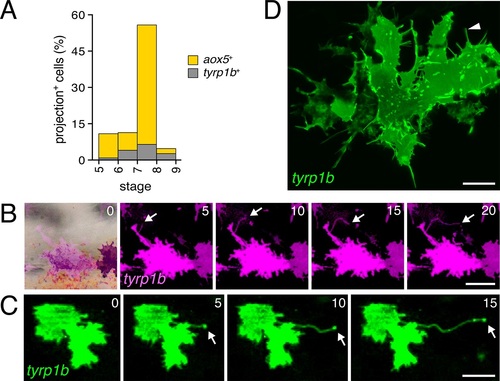
Rare fast projections of zebrafish melanophores. (A) Incidences of projections by tyrp1b+ and aox5+ cells of melanophore and xanthophore lineages, respectively. (B and C) Examples of tyrp1b+ melanophores extending projections that were indistinguishable from those of aox5+ cells; labeling: membrane targeted mCherry (B) and GFP (C). (D) High resolution image of tyrp1b+ melanophore, illustrating abundant, short filopodial projections (arrowhead). Scale bars: 50 µm (B and C); 10 µm (D). |
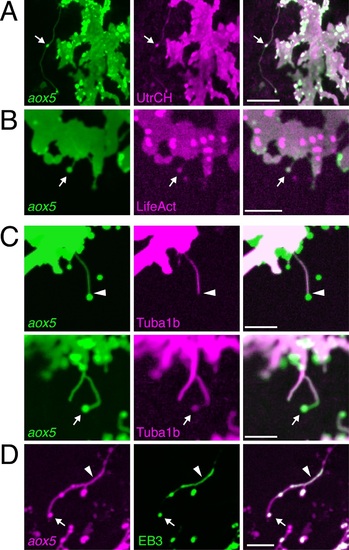
(A, B) aox5+ projections and puncta (arrowheads) labeled for F-actin, revealed by UtrCH-mCherry (A) and LifeAct-mKate (B). (C) Projections contained tubulin, as revealed by Tuba1b-mCherry. In some instances tubulin was absent from vesicles (arrowhead, upper) and in other instances was found in vesicles (arrow, lower). (D) Accumulations of microtubule end binding protein EB3 fused to GFP (arrowhead), were present in vesicles as well (arrow); aox5 here drives mCherry. Scale bars: 20 µm (A); 10 µm (B, C, D). EXPRESSION / LABELING:
|
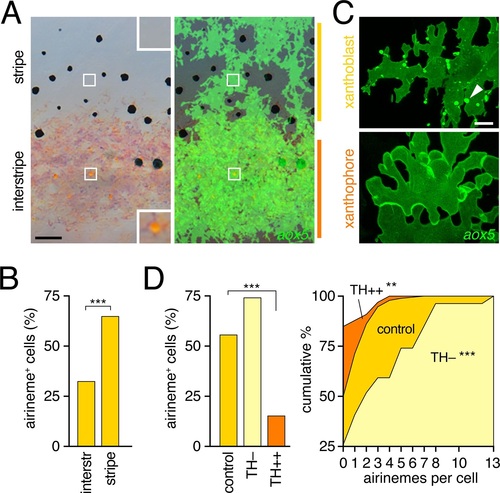
Airinemes were produced by xanthoblasts within prospective stripe regions.(A) Detail of developing pattern in zebrafish, illustrating pigmented aox5+ xanthophores of the interstripe as well as unpigmented aox5+ xanthoblasts of the prospective stripe (insets, boxed regions shown at higher magnification). Larva shown is 8.6 SSL, when xanthophore pigment is more readily visible, but after the peak of airineme production (Figure 1C). (B) aox5+ cells in prospective stripe regions were more likely to extend airinemes than aox5+ cells of the interstripe (χ2=28.6, d.f.=1, p<0.0001, N=295 cells). (C) Xanthoblasts (upper) had numerous membrane blebs (arrowhead), whereas xanthophores (lower) had smooth surfaces and more lobular edges (7.8 SSL). (D) Forced differentiation (TH++) reduced the incidence of cells that extended airinemes (left; χ2=12.2, d.f.=1, p<0.0001, N=123 cells) and the numbers of airinemes extended by each cell (right; TH++; χ2=12.0, d.f.=1, p<0.05), whereas differentiation-arrest increased airineme production (TH–; χ2=29.6, d.f.=1, p<0.0001; 7.5 SSL) Scale bars: 50 µm (A); 10 µm (C). EXPRESSION / LABELING:
|
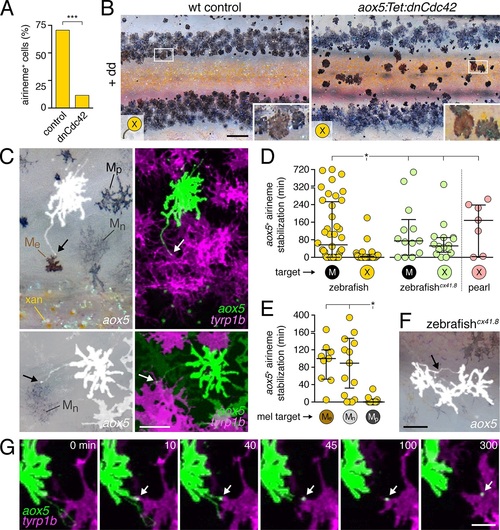
Airineme dependent patterning and airineme targeting specificities.(A) dnCdc42 blocks airineme extension (χ2=16.4, d.f.=1, p<0.0001, N=43 cells total). (B) Interstripe melanophores persisted when airinemes were blocked with dnCdc42. Cell states are indicated by logos in lower left corners (X, aox5+ xanthophore lineage). Insets, brownish melanophores persisting from embryonic/early larval pattern and gray–black adult melanophores. (C) Airinemes contacting melanophores (arrows; Me, early larval; Mn, new; Mp, previously differentiated; xan, xanthophore). (D) Stabilization times (median ± IQR) of aox5+ airinemes on cells of melanophore (M) or xanthophore (X) lineages for zebrafish, cx41.8 mutant zebrafish, and pearl danio. aox5+ airinemes of wild-type zebrafish were less likely to stabilize, and stabilized more briefly (*, both p<0.0001) after contacting cells of the xanthophore lineage as compared to melanophores; this target specificity was altered in cx41.8 mutant zebrafish as well as pearl danio. Y-axis is split for clarity. (E) Zebrafish aox5+ airinemes were most likely to stabilize on Me and Mn (*, p<0.0001; median ± IQR). (F) cx41.8 mutant airinemes stabilized on aox5+ cells (arrow). (G) Vesicle transfer (arrow) to melanophore. Scale bars: 200 µm (B); 50 µm (C); 50 µm (F); 25 µm (G). EXPRESSION / LABELING:
PHENOTYPE:
|
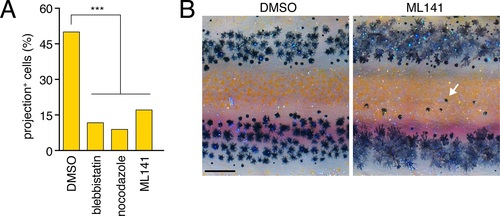
Pharmacological blockade of airineme production.(A) Cytoskeletal inhibitors reduced projection formation relative to controls (overall: χ2=24.0, d.f.=3, p<0.0001; among inhibitors: χ2=1.7, d.f.=2, p=0.4, N=212 cells). (B) Treatment with Cdc42 inhibitor ML141 resulted in excess interstripe melanophores (arrow). Fish were treated with epinephrine to partially contract pigment granules toward cell centers. Scale bar: 200 µm (B). |
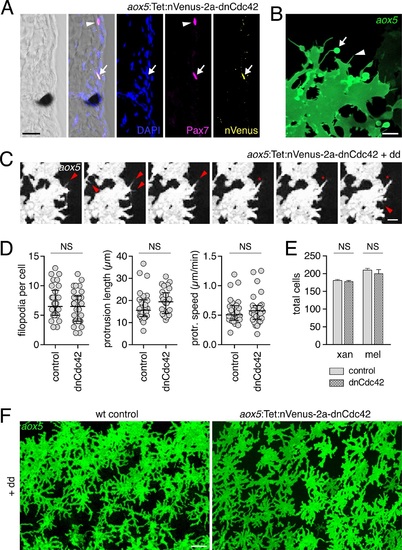
Expression of dnCdc42 transgene for inhibition of airinemes.(A) Trunk cross-section during pigment pattern formation (~7.5 SSL) for individual expressing aox5:Tet:nVenus-2a-dnCdc42 mosaically and stained for Venus immunoreactivity. Nuclear-localizing Venus was co-expressed with xanthophore lineage marker Pax7 (Minchin and Hughes, 2008) (arrow; arrowhead indicates a Pax7+ cell not carrying the transgene). (B) High-resolution micrograph of aox5+ xanthoblast in wild-type zebrafish (7.5 SSL) illustrating airineme with vesicle (arrow) as well as short filopodia that lack vesicles (e.g., arrowhead). (C) Frames from time-lapse imaging (5 min intervals) showing aox5+ cells after several days of dd treatment to express dnCdc42 at low levels. Short filopodia (e.g., arrowheads) and other protrusions (e.g., *) were extended despite inhibition of airineme production. (D) Analyses of protrusive activities in time-lapse videos revealed no significant differences in numbers of short filopodia extended (left: t58=1.07, p=0.3), lengths of lamellipodial protrusions (center: t54=1.20, p=0.2), or speeds of lamellipodial extension (right: t54=0.62, p=0.4). (E) Following extended dd-induction of dnCdc42 (6.5–12.5 SSL), there were not significant differences in the total numbers of xanthophores (t8=0.83, p=0.4) or melanophores (t8=0.27, p=0.8) relative to dd-treated non-transgenic controls. (F) Distributions of aox5+ cells were similar between dd-treated dnCdc42 and control larvae. Scale bars: 20 µm (A); 5 µm (C); 20 µm (C); 50 µm (F). |
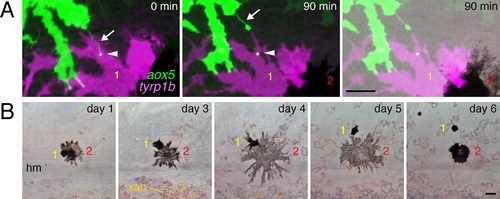
Prolonged airineme contact with motile melanophores.(A) Example of aox5+ airineme (arrow) contacting tyrp1b+ melanophore (yellow 1), with vesicle (arrowhead) that persisted at least 90 min; a second melanophore is adjacent (red 2) (B) Contacted melanophores were motile: over several days, melanophore 1 traversed melanophore 2 and came to rest in a relatively more dorsal position within the developing stripe. hm, horizontal myoseptum. xan, xanthophore. Scale bars: 20 µm (A); 20 µm (B). |

Connexin dependence of airineme production.(A) Phenotypes of wild-type and cx41.8 mutant zebrafish. (B) Stage-specificity of airineme production and numbers of airinemes produced per cell differed between wild-type and cx41.8 mutant zebrafish (left, genotype x stage interaction: χ2=94.2, d.f.=1, p<0.0001, N=639 cells; right, χ2=51.1, d.f.=7, p<0.0001, N=428 cells). Scale bar: 1 mm (A). |
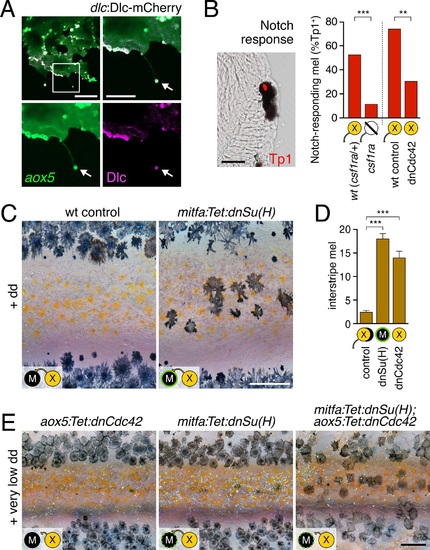
Melanophore clearance requires airineme-dependent Notch signaling in melanophores.(A) aox5+ airineme vesicles harbored DlC-mCherry (arrow). (B) Frequencies of Tp1+ Notch-responding melanophores were reduced in the absence of aox5+ cells (csf1ra; χ2=15.5, d.f.=1, p<0.0001, N=77 cells) or airinemes (dnCdc42; χ2=9.0, d.f.=1, p<0.005, N=46 cells). Epidermal and muscle cells were also Tp1+ (not shown) but within the hypodermis, where pigment cells reside (Hirata et al., 2003), we observed only melanophores to be Tp1+. (C) Interstripe melanophores persisted when Notch signaling was blocked within the melanophore lineage by dnSu(H) [melanophore logo with green outlining], similar to dnCdc42 blockade of aox5+ airinemes (compare with Figure 4B). (D) Quantification of interstripe melanophores (mean ± SE) in dd-treated non-transgenic fish as well as mitfa:Tet:dnSu(H) and aox5:Tet:dnCdc42 (overall, F2,12=58.6, p<0.0001). (E) When induced with threshold levels of dd, persisting interstripe melanophores (means ± SE) were threefold more abundant (t7=2.9, p<0.05) in fish doubly transgenic for mitfa:Tet:dnSu(H) and aox5:Tet:dnCdc42 as compared to singly transgenic fish (shown at 9.8 SSL). Scale bars: 15 µm (A, left); 10 µm (A, right); 20 µm (B); 200 µm (C); 200 µm (E). EXPRESSION / LABELING:
PHENOTYPE:
|
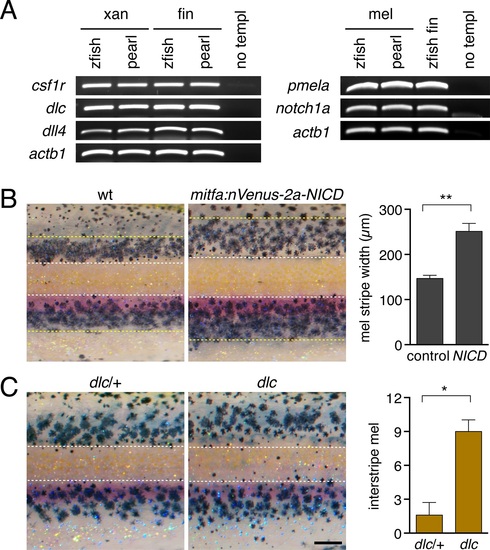
Delta-Notch gene expression and patterning consequences.(A) Delta genes dlc and delta-like 4 (dll4) are expressed by isolated xanthophores of zebrafish and pearl danio. csf1r, xanthophore lineage marker; actb1, actin b1. notch1a is expressed by melanophores of both species. pmela, melanophore lineage marker. Fins containing numerous cell types are positive controls. Preliminary surveys also revealed a variety of additional Delta-Notch ligands and receptors expressed by cells in skin and other tissues in the environment of pigment cells that were not expressed detectably in xanthophores or melanophores (data not shown). (B) Zebrafish expressing constitutively active Notch intracellular domain (NICD) in the melanophore lineage exhibited wider stripes (t8=5.4, p<0.001) yet ~30% fewer melanophores (t8=6.9, p<0.0001) than non-transgenic siblings. Dashed yellow lines, approximate dorsal- and ventral-most stripe boundaries. (C) Zebrafish dlc mutants have more interstripe melanophores than wild-type siblings (t9=4.8, p<0.001), though total melanophore numbers were not different (P=0.6). Dashed lines, approximate location boundaries of interstripe as determined for wild-type fish (see Materials and methods). Scale bar: 200 µm (in B, for A and B). |
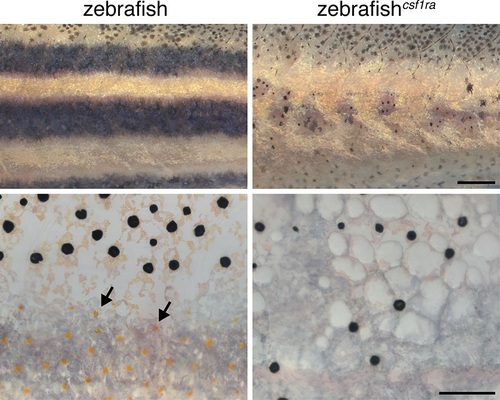
Failure of stripe consolidation in xanthophore-deficient zebrafish.Wild-type compared to csf1ra (panther) mutant zebrafish that lacks virtually all xanthophores (arrows) (Parichy et al., 2000; Patterson and Parichy, 2013). Melanophores were widely dispersed in the csf1ra mutants. Scale bars: 500 µm (upper); 100 µm (lower). |
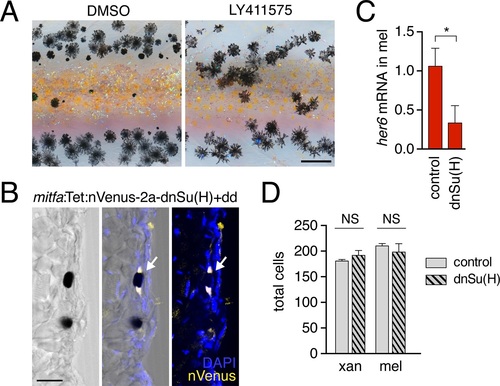
Notch signaling inhibition.(A) Treatment with Notch inhibitor LY411575 during adult pigment pattern development caused defects in melanophore clearance and stripe consolidation. (B) Induction of mitfa:Tet:nVenus-2a-dnSu(H) in melanophores of stable transgenics reduced expression of Notch target gene her6 (p<0.05) in isolated melanophores, relative to non-transgenic but dd-treated controls. (C) Melanophore of fish mosaically expressing mitfa:Tet:nVenus-2a-dnSu(H) stained for nuclear-localizing Venus by immunohistochemistry (arrow); nucleus is bipartite. Scale bar. (A) Extended induction of mitfa:Tet:nVenus-2a-dnSu(H) in melanophores did not affect total numbers of xanthophores (t8=0.92, p=0.4) or melanophores (t8=0.70, p=0.5) relative to dd-treated non-transgenic controls. Fish analyzed here were performed concurrently with those of Figure 4 - figure supplement 2E and employed the same controls. Scale bars: 200 µm (A); 20 µm (C). |
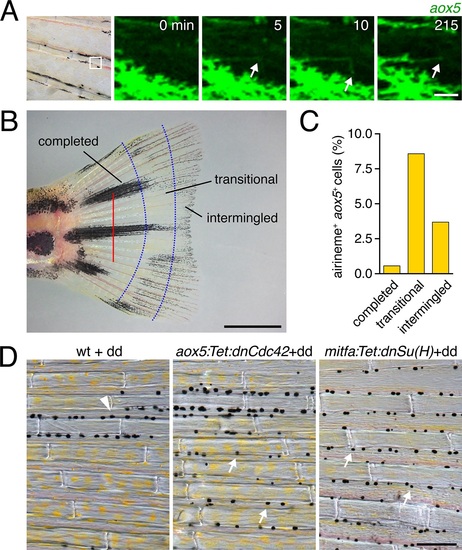
Airinemes and patterning in the zebrafish caudal fin.(A) aox5+ cell extending airineme (arrowhead) in the regenerating fin. (B) Regenerative fin regions examined. Red bar, amputation plane. From distal to proximal, pattern formation is on-going (‘intermingled’), melanophores are consolidating into stripes (′transitional′), or stripes and interstripes have been fully re-formed (‘completed’) (Rawls and Johnson, 2000). (C) Airinemes were produced most often by aox5+ cells of the transitional zone (χ2=17.4, d.f.=2, p<0.0005, N=651 cells), though were less frequently observed than during the adult body pattern development. (D) Wild type, controls treated with dd during fin ontogeny had melanophores principally within stripes (arrowhead) whereas dd-treated individuals stably expressing dnCdc42 or dnSu(H) in the xanthophore or melanophore lineages, respectively, had melanophores that were more widely dispersed (arrows). Scale bars: 25 µm (A); 2 mm (B); 100 µm (C). |
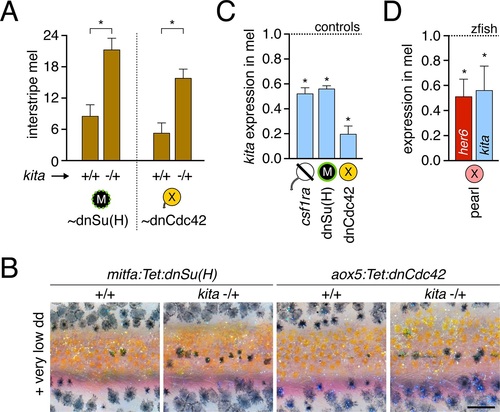
Dependence of melanophore kita expression on airinemes and Notch signaling.(A) kita heterozygosity sensitized melanophores (means ± SE) for reduced Notch signaling [dnSu(H); t7=4.0, p<0.005] or airineme production (dnCdc42; t6=4.0, p<0.005). (B) Excess interstripe melanophores in kita heterozygotes compared to fish homozygous wild type for kita when Notch signaling or airinemes are inhibited. (C) kita expression (means ± SE) was reduced upon depletion of xanthophore lineage, Notch signaling or airinemes (one-tailed, paired t2=9.9, 7.6, 5.0; all p<0.05). (D) In pearl melanophores, Notch signaling (her6; Figure 5—figure supplement 1C) and kita expression (means ± SE) were reduced in comparison to zebrafish melanophores (one-tailed, paired t2=3.4, 3.4; p<0.05). Scale: 200 µm (B). |

Factors extrinsic to the aox5+ cells inhibit airineme production and signaling in pearl and models for airineme signaling and its evolution.(A) Left, Pearl aox5+ cells extended more airinemes when differentiation-arrested (TH–; χ2=12.5, d.f.=1, p<0.0005, N=412 cells). Right, zebrafish aox5+ cells transplanted to pearl, or receiving excess Csf1 in zebrafish, extended fewer airinemes than comparably staged aox5+ cells in unmanipulated zebrafish (χ2=23.1, 22.1, d.f.=1, 1; p<0.0001, N=846 cells total). (B) In chimeras resulting from transplants of zebrafish donors (aox5:membrane-GFP, ubiquitous ubb:mCherry [Mosimann et al., 2011]) to pearl hosts, zebrafish aox5+ cells (arrow) were typically intermingled with pearl melanophores, as well as ubb+ zebrafish melanophores (arrowheads). (C) Working models for pigment cell interactions and pattern formation in zebrafish (left) and pearl danio (right). In zebrafish, xanthoblasts in stripe regions extend airinemes that signal to melanophores (Xb→M), promoting their clearance from the interstripe during stripe consolidation. Results of this study are consistent with interactions involving xanthoblast airineme dependent Delta (Dlc or possibly Dll4) activation of Notch signaling in melanophores, and the potentiation of Kita-dependent melanophore motility. Nevertheless, these data do not exclude roles for additional modes of Delta–Notch signaling, or the possibilities that airinemes transduce additional signals, or signals that cannot be distinguished from the Delta–Notch pathway using the experimental paradigms here employed. Analyses of mutant zebrafish further support roles for Cx41.8 in contributing to airineme-dependent communication, through modulation of target specificity or xanthophore lineage differentiation. In addition to xanthoblast–melanophore interactions, iridophores have attractive and repulsive effects on melanophores (I→M; I⊣M) (Frohnhofer et al., 2013; Patterson and Parichy, 2013) and express Csf1, promoting the differentiation of xanthophores (Xb→X) at the interstripe (Patterson and Parichy, 2013). Differentiated xanthophores repel melanophores (X⊣M) during normal development (Nakamasu et al., 2009) and are capable of repressing iridophore organization (X⊣I) [for details, see: (Patterson et al., 2014)]. In pearl danio, Csf1 is expressed at elevated levels by cells other than iridophores and this drives earlier and broader xanthophore differentiation than in zebrafish (Patterson et al., 2014). Precocious, widespread differentiation of xanthophores likely limits directional cues available to melanophores while simultaneously curtailing the potential for airineme signaling, as airineme competent xanthoblasts are depleted. Tissue contexts (lower panels) also show eventual death of some melanophores remaining in the interstripe in zebrafish (Parichy et al., 2000; Parichy and Turner, 2003b) and the higher overall incidence of melanophore death in pearl danio (Quigley et al., 2005); iridophores are omitted for clarity. Scale bar: 50 µm (B). |

Interspecific chimeras reveal non-autonomous effects on pattern and aox5+ cell behaviors.(A) In zebrafish→pearl chimeras, well-organized stripes of zebrafish cells formed but only when all three classes of zebrafish pigment cells (inset: x, xanthophore; m, melanophore; i, iridophores) were present and in the vicinity of other zebrafish tissues (blue outline, donor myotomes). Ten adult chimeras analyzed. (B) In pearl→albino zebrafish chimeras (in which host melanophores were present but unpigmented), pearl melanophores were confined to stripes, adopting a zebrafish-like arrangement; stripe-interstripe boundaries are indicated by dashed white lines and interstripes by yellow-orange bars at left. (C) Pearl aox5+ cells frequently developed in zebrafish hosts at embryonic/early larval stages (N=90 aox5+ chimeras), yet these same cells typically died by prior to time-lapse imaging during adult pigment pattern formation, here apparent by fragmentation and extrusion of GFP+ debris, typical of pigment cell death in zebrafish (Lang et al., 2009; Parichy et al., 1999). (D) Prior to extrusion, rare, surviving pearl danio aox5+ cells could extend numerous airinemes in zebrafish hosts (3 airinemes are shown; *, aox5+ cell fragmenting during imaging). Scale bars: 100 µm (A, for A and B); 20 µm (C); 50 µm (D). |

Unillustrated author statements PHENOTYPE:
|