
- Title
-
Characterization of the zebrafish cx36.7 gene promoter: Its regulation of cardiac-specific expression and skeletal muscle-specific repression
- Authors
- Miyagi, H., Nag, K., Sultana, N., Munakata, K., Hirose, S., Nakamura, N.
- Source
- Full text @ Gene
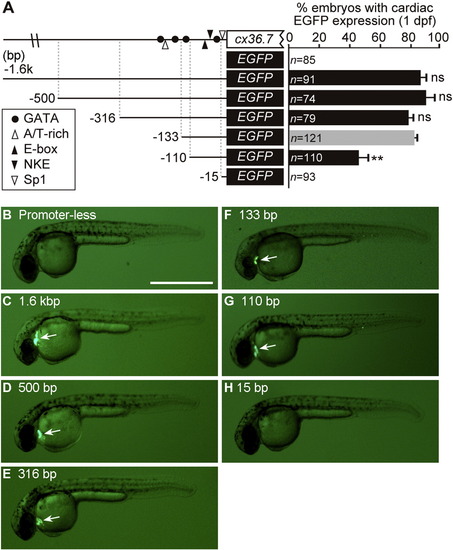
Deletion analysis of the cx36.7 promoter in 1-dpf zebrafish embryos. (A) Top: schematic representation of the 5′-flanking region of the cx36.7 gene, depicting the positions of the GATA (filled circle), A/T-rich (open triangle), E-box (filed triangle), NKE (filed reversed triangle) and Sp1 (open reversed triangle) elements. Bottom: schematic representation of the 5′ deleted promoter–EGFP chimeras that were inserted between the tol2 elements in the pT2KXIGΔin vector. The reporter constructs were injected into fertilized one-cell eggs. EGFP signals in transgenic zebrafish were analyzed at 1 dpf. The bar graphs represent the percentage of embryos with cardiac-specific EGFP expression. Data are expressed as the mean ± SEM of at least three independent experiments. Significant differences for the value of the 133-bp promoter construct (**, p < 0.001) were found by one-way ANOVA with Tukey′s post-hoc test. ns, no significant difference. (B–H) Representative images of 1-dpf embryos showing no EGFP expression (B and H) or cardiac-specific EGFP expression (C–G, arrows). Bar, 1 mm. |
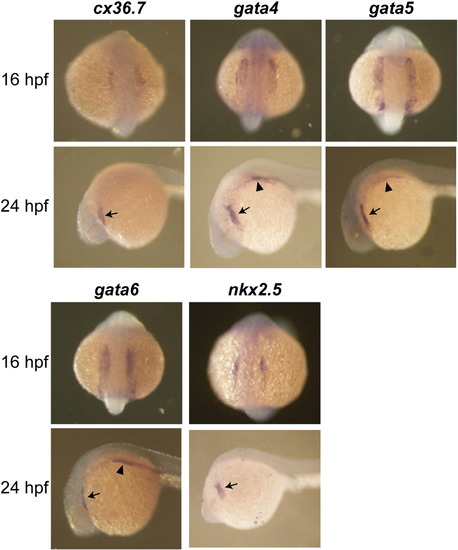
The expression of cx36.7, gata4, gata5, gata6 and nkx2.5 in zebrafish embryos. Whole mount in situ hybridization of zebrafish embryos at 16 hpf (top) and 24 hpf (bottom) was performed with antisense RNA probes specific to cx36.7, gata4, gata5, gata6 and nkx2.5. The cx36.7 expression was detected in the developing heart regions in which gata4, gata5, gata6 and nkx2.5 are expressed. Arrows, hearts; arrowheads, gut. |
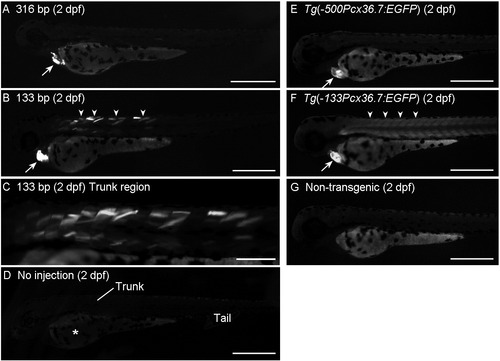
EGFP expression in transgenic embryos using the 316- or 133-bp promoter constructs. (A and B) One-cell stage fertilized eggs were injected with the 316- (A) or 133-bp (B and C) promoter constructs. At 2 dpf, EGFP expression was observed. Typical images of embryos with EGFP expression in the heart (arrows) and trunk muscle (arrowheads) are shown. (C) A high magnification image of the trunk region of the embryo in B. (D) An image of a control embryo without injection is shown. Zebrafish embryos exhibit high autofluorescence in the yolk sac (asterisk). (E and F) EGFP expression of 2-dpf stable zebrafish lines carrying the 500- (E) or 133-bp (F) promoter constructs. EGFP signal in the heart and trunk muscle is indicated by arrows and arrowheads, respectively. (G) An image of a control non-transgenic embryo is shown. Bars, 500 µm (A, B, and D–G) and 200 µm (C). |

EGFP expression in transgenic embryos with the mutant 316-bp promoter constructs. Fertilized one-cell eggs were injected with the 316-bp promoter constructs having point mutations in the indicated GATA and A/T-rich elements. Typical images of the trunk region of the 2-dpf (A–F) or 3-dpf (G and H) embryos are shown. The arrowheads indicate EGFP signals in the trunk muscle. The asterisks indicate yolk sac autofluorescence. Bars, 200 µm. |
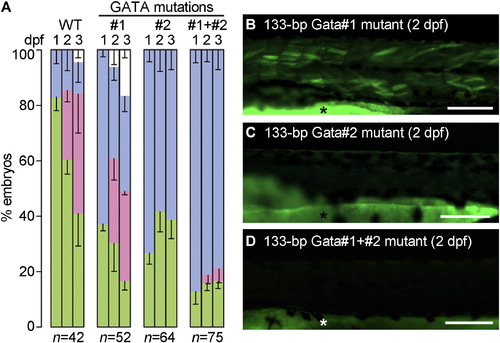
Mutational analysis of the 133-bp promoter. (A) Fertilized one-cell eggs were injected with the 133-bp promoter construct (WT) or its mutants with point mutations in either one or both of the GATA #1 and #2 elements. EGFP signals in the embryos were analyzed at 1, 2 and 3 dpf. The stacked bar charts represent the percentages of the following four groups of embryos: no EGFP expression (blue), cardiac-specific EGFP expression (green), EGFP expression in the heart and trunk muscle (red), and dead embryos (white). Data are expressed as the mean ± SEM of three independent experiments. (B–D) Representative images of the trunk region of 2-dpf embryos injected with the 133-bp promoter constructs having mutations in GATA #1 (B), GATA #2 (C), and both GATA #1 and GATA #2 (D). The asterisks indicate yolk sac autofluorescence. Bars, 0.2 mm. |
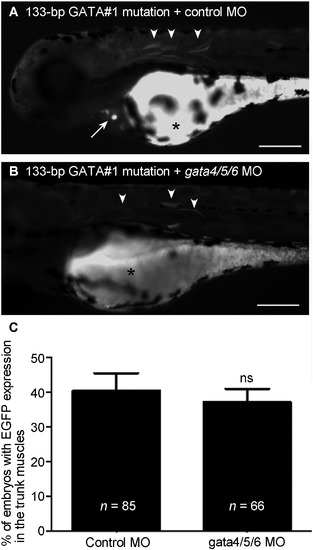
Effect of cardiac gata knockdown on promoter activation in skeletal muscle. (A and B) The 133-bp promoter construct with the GATA #1 mutation was co-injected into fertilized one-cell eggs along with control MOs (A) or gata4, gata5 and gata6-specific MOs (B). EGFP signals in the embryos were analyzed at 2 dpf. The arrow and arrowheads indicate EGFP signals in the heart and trunk muscle, respectively. The asterisks indicate yolk sac autofluorescence. Bars, 0.2 mm. (C) The bar graph represents the percentages of the embryos with EGFP expression in the trunk muscle. Data are expressed as the mean ± SEM of three independent experiments. No significant difference (ns) from the value of control-MO-injected embryos was found using Student′s t-test. |
Reprinted from Gene, 577(2), Miyagi, H., Nag, K., Sultana, N., Munakata, K., Hirose, S., Nakamura, N., Characterization of the zebrafish cx36.7 gene promoter: Its regulation of cardiac-specific expression and skeletal muscle-specific repression, 265-74, Copyright (2016) with permission from Elsevier. Full text @ Gene