
- Title
-
Determination of the source of SHG verniers in zebrafish skeletal muscle
- Authors
- Dempsey, W.P., Hodas, N.O., Ponti, A., Pantazis, P.
- Source
- Full text @ Sci. Rep.
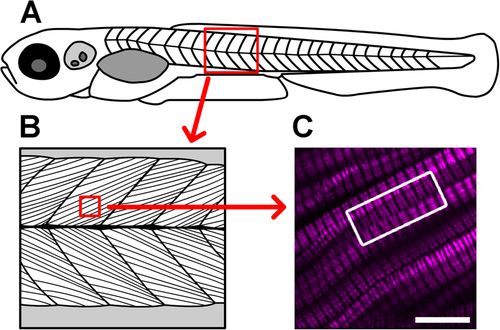
Verniers are regions of distorted endogenous muscle myosin SHG (magenta) that are visible deep within the somite. (A) This cartoon depicts a 5 dpf larva (not to scale). The red boxed area highlights a portion of the skeletal muscle compartment, which is illustrated in more detail in (B), showing the oriented arrays of muscle cells within the tissue. (C) In this image from a 5 dpf, laterally mounted, and fixed WT larva, clear distortions can be appreciated in the SHG signal within muscle cells (curvature toward the edges of the SHG bands in much of the image). The white boxed region draws attention to SHG verniers that appear to span across adjacent muscle cells, suggesting potential physical connections between cells across their membrane boundaries. Scale bar: 10 µm. |
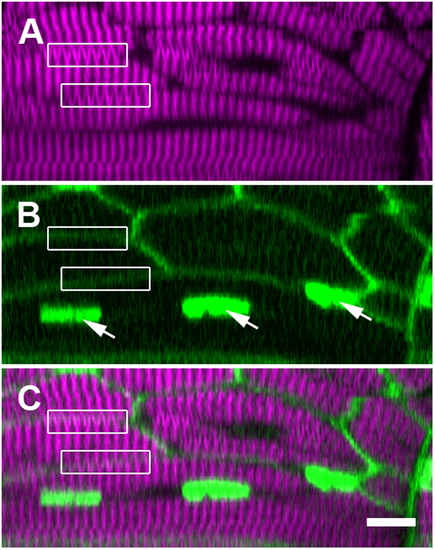
SHG verniers seem to cross intact membrane boundaries, indicating their illusory origin. These panels display a single ‘xz’ cross section within a trunk somite of a fixed 5 dpf zebrafish larva, where the membranes and nuclei are FP labeled (see Supporting Information, Methods). (A) Verniers (‘Y’-shaped) are visible within much of the thick filament-derived SHG signal (magenta). (B) Fluorescent reporter expression (green) illuminates the plasma membranes (diffuse borders) of the several visible muscle fibers as well as the nuclei within one particular cell (arrows). (C) The merged image of fluorescence and SHG signal shows that many SHG verniers seem to cross the physical membrane boundaries of the muscle cells (boxed regions, compare to the same boxed regions in panel A,B). Sarcomeric components should not connect across adjacent cell boundaries under normal physiological circumstances, especially in an unperturbed WT larva. Scale bar: 10 µm. EXPRESSION / LABELING:
|
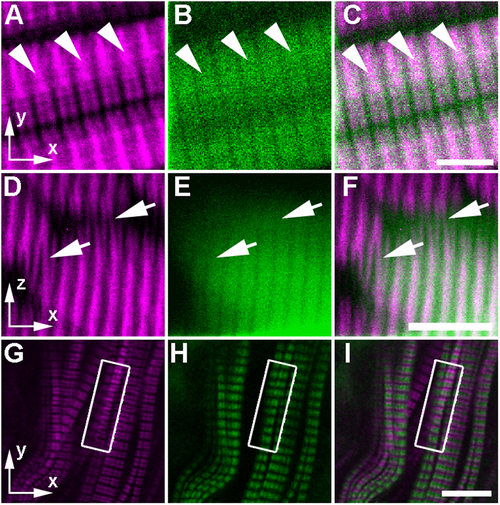
Apparent curvature in the sarcomere structure is only visible within the SHG channel when imaging fluorescently labeled sarcomeric proteins in zebrafish embryos. (A–F) In preparation for imaging, zebrafish larvae at 7 dpf were fixed and sparsely immunostained with anti-myosin MF20 primary and goat-anti-mouse-AF488 secondary antibodies (see Methods). In sagittal optical sections, (A) SHG signal (magenta) can be single banded and bifurcated, even within a single sarcomere (arrowheads), while (B) the TPEF signal (green) from each individual sarcomere can be seen as a single wide-band with gaps only at the I bands of the sarcomere (where myosin is absent), as predicted by the theoretical model. (C) The merged image shows the colocalization of SHG and TPEF signal within the thick filaments. In transverse optical sections, (D) adjacent myofibers seem to be linked by myosin verniers (arrows) in the SHG channel. (E) In the AF488 fluorescence channel (green), the banding pattern does not bifurcate at all (see the arrows pointing to the same regions as in (panel D). (F) In the merged image, the SHG signal and the fluorescent signal overlap within the labeled myofiber but do not show the same vernier signal pattern (arrows). Thus, the vernier patterns are only present in the SHG channel. (G–I) In this single sagittal optical section of the superficial slow muscle layer of a laterally mounted, fixed 5 dpf Gt(tpm3-citrine)ct5a zebrafish larva, the thin filaments are visible, because endogenous tropomyosin 3 is fluorescently tagged. The box in each panel indicates the region where distortions appear in the SHG channel alone. (G) In the SHG channel, verniers can be seen as local curvature in the sarcomeric banding pattern. (H) In contrast, there is no curvature in the TPEF banding pattern, indicating that the sarcomeres are not actually physically distorted in this region. (I) This is demonstrated further in the merge of (panels G,H), where the distorted SHG vernier signal seems to overlap with the adjacent fluorescence band within the same muscle fiber. Scale bars: (A–C), 5 µm; (D–I), 10 µm. EXPRESSION / LABELING:
|
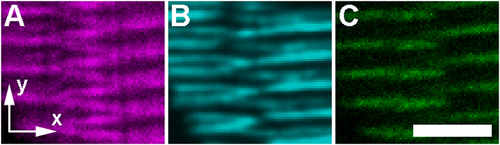
A theoretical model built upon fluorescence data agrees with actual vernier pattern SHG signal in whole mount zebrafish tissue. A fixed 5 day post fertilization zebrafish larva was immunostained with an anti-myomesin antibody, which selectively labels the M-line of skeletal muscle sarcomeres. A full 3D volume was imaged (see Supplementary Methods), and a region of interest with apparent SHG verniers was selected to test the theoretical model. (A) SHG signal (magenta) within a single optical section near the center of the imaged 3D volume shows clear vernier pattern SHG signal between two adjacent myofibers. (B) Synthetic SHG signal (cyan) was generated using our theoretical model (see Theory), starting with the (C) anti-myomesin TPEF signal (green) as a reference point for the M-line location and extent of each sarcomere. Scale bar: 5 µm. EXPRESSION / LABELING:
|