
- Title
-
Standardized orthotopic xenografts in zebrafish reveal glioma cell line specific characteristics and tumor cell heterogeneity
- Authors
- Welker, A.M., Jaros, B.D., Puduvalli, V.K., Imitola, J., Kaur, B., Beattie, C.E.
- Source
- Full text @ Dis. Model. Mech.
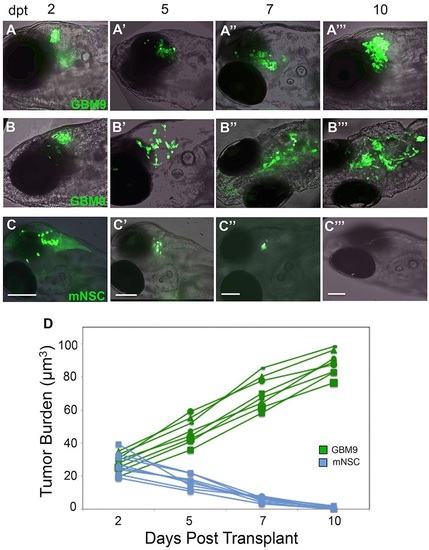
Analysis of tumor burden in live animals over time. Confocal images superimposed on bright field (anterior to the left) of two representative casper zebrafish transplanted with 50-75 GBM9 cells (A-A′′′,B-B′′′) and a casper animal transplanted with control mNSC cells (C-C′′′) imaged at 2 (A,B,C), 5(A′,B′,C′), 7(A′′,B′′,C′′) and 10 (A′′′,B′′′,C′′′) dpt. Examples of a compact (A-A′′′) and diffuse tumor (B-B′′′) are shown. (D) Tumor burden were quantified using volume measurements of florescence in micrometers cubed. Approximately 50-75 GBM9 cells (green lines) and ~50 mNSC cells (blue lines) were transplanted and followed over time in the same animal. n=8 animals per group. Scale bars: 100 µm. |
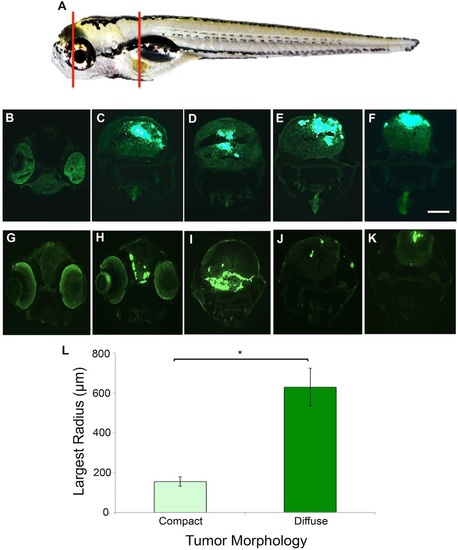
GBM9 tumor cells grow throughout the brain tissue. (A) Representative area sectioned (red lines) in a 7 dpt zebrafish. (B-F) Transverse 20-µm-thick cryosections of a GBM9 compact tumor at the level of the forebrain (B), midbrain (C,D) and hindbrain (E,F). (G-K) Transverse cryosections of a diffuse tumor at the level of the forebrain (G,H) midbrain (I) and hindbrain (J,K). (L) Based on morphology, tumors were scored as compact (light green bar) or diffuse (dark green bar) then measured by Sholl analysis at 7 dpt to quantify cell spread. Largest radius (in micrometers) is the measure of the farthest radius intersecting a cell from the injection site. n=10 per group; 20 animals total. *P<0.001. Scale bar: 100 µm for B-K. |
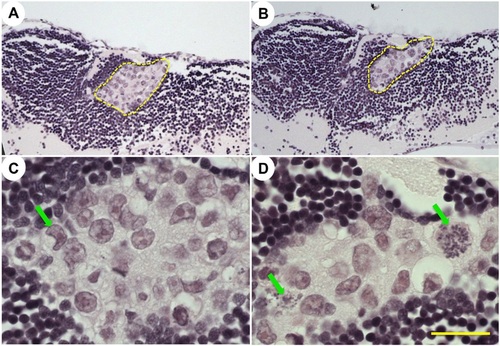
GBM9 histology staining for Hematoxalin and Eosin. (A-D) Paraffin-embedded GBM9 xenotransplanted animals at 7dpt; 40× (A,B) and 100× (C,D) magnification of two separate animals (A,C and B,D) with tumors. Yellow dashed lines in A,B denote the tumor mass. Green arrows in C,D denote hyperchromatic and abnormal nuclei. Scale bar: 50µm in A,B and 20µm in C,D. |
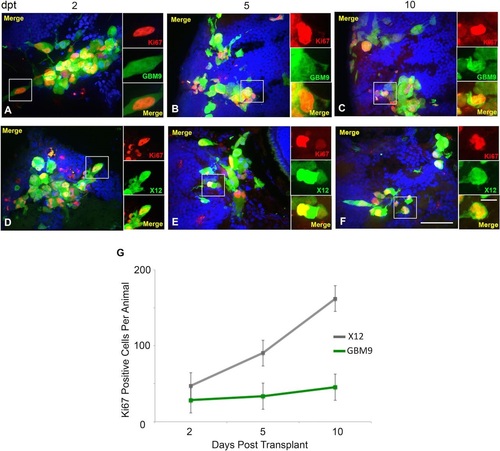
GBM9 and X12 xenotransplants contain a high number of dividing cells. (A-F) Confocal images of GBM9 and X12 on 2 (A,D), 5 (B,E) and 10 (C,F) dpt transverse cryosections. (A-C) GBM9 (green), DAPI (blue) and Ki67 (red) at 100×. (D-F) X12 (green), DAPI (blue) and Ki67 (red) at 100×. White boxes denote magnified area to the right of the image. n=5 animals per group; 30 animals total. Scale bar: 20µm for main panels and 5µm for insets. (E) Quantification of the total number of dividing cells per animal at each time point for GBM9 (green line) and X12 (gray line) transplants. |
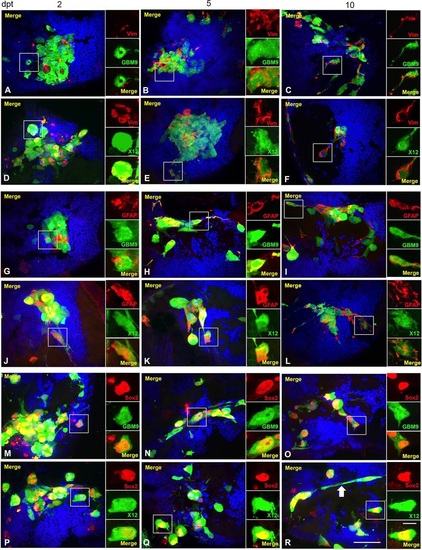
GBM9 and X12 tumors contain a combination of differentiated cells and stem cells. Confocal images of GBM9 and X12 on 2 (A,D,G,J,M,P), 5 (B,E,H,K,N,Q) and 10 (C,F,I,L,O,R) dpt transverse cryosections. (A-C) GBM9 (green), DAPI (blue) and vimentin (red) at 100×. (D-F) X12 (green), DAPI (blue) and vimentin (red) at 100×. (G-I) GBM9 (green), DAPI (blue) and GFAP (red) at 100×. (J-L) X12 (green), DAPI (blue) and GFAP (red) at 100×. (M-O) GBM9 (green), DAPI (blue) and Sox2 (red) at 100×. (P-R) X12 (green), DAPI (blue) and Sox2 (red) at 100×. White boxes denote area magnified to the right of the image. White arrow in R points to a cell with a migratory morphology. n=5 animals per group; 90 total animals. Scale bar: 20µm for main panels and 5µm for insets. |
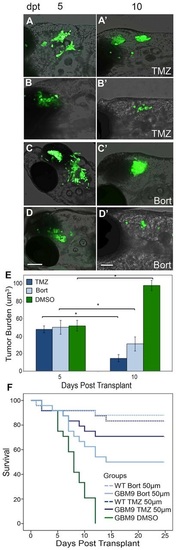
Chemotherapeutic agents decrease GBM9 xenotransplant tumor burden. GBM9 xenotransplants were treated with 50 µM drug continuously between 5 and 10 dpt. (A-D′) Confocal images superimposed on bright field (anterior to the left) of two GBM9 animals at 5 dpt (A,B) and at 10 dpt after 5 days of temozolomide (TMZ) treatment (A′,B′). (C,D) Confocal images superimposed on bright field (anterior to the left) of two GBM9 animals at 5 dpt (C,D) and at 10 dpt after 5 days of bortezomib (Bort) treatment (C′,D′). (E) Quantification of tumor burden (in micrometers cubed) before treatment (5 dpt) and after 5 days of treatment (10 dpt). n=10 animals per group. *P<0.001. (F) Kaplan–Meier survival curve of animals during drug treatment (5-10 dpt) with temozolomide (dark blue line) and bortezomib (light blue line). Control DMSO treated GBM9 animals (green line) have a median survival of 8±0.6 days. Of the animals treated with TMZ, 70.8% lived until 25 days compared with 50.0% treated with bortezomib. Of the wild-type animals treated with 50 µm TMZ (dashed dark blue line) or bortezomib (dashed light blue line), 83.3 and 88.0%, respectively, survived. n=48 animals for all groups. P<0.0001 for GBM9 DMSO versus both GBM9 TMZ and GBM9 Bort. P=0.0672 for GBM9 TMZ versus GBM9 Bort. Scale bars: 100 µm. |