
- Title
-
Posterior-anterior gradient of zebrafish hes6 expression in the presomitic mesoderm is established by the combinatorial functions of the downstream enhancer and 3'UTR
- Authors
- Kawamura, A., Ovara, H., Ooka, Y., Kinoshita, H., Hoshikawa, M., Nakajo, K., Yokota, D., Fujino, Y., Higashijima, S.I., Takada, S., Yamasu, K.
- Source
- Full text @ Dev. Biol.
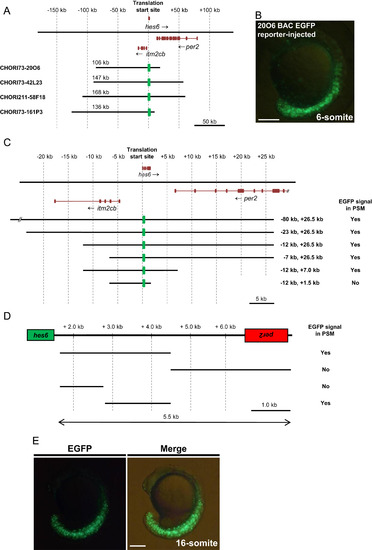
Identification of the transcriptional regulatory region that drives hes6 expression in the PSM and tailbud of zebrafish embryos. (A) Schematic representation of the genomic region that encompasses hes6 in zebrafish. Exons in each gene are shown by dark brown boxes and the arrows indicate the direction of transcription. The numbers above the genomic region represents the distance from the translation start site in hes6. The genomic regions encompassed by the four BAC clones used in this study are shown below the genomic region. The insert length of each BAC clone is shown above the bar. The green boxes represent the EGFP reporter inserted in the first exon of hes6 in each BAC clone. At this scale, the hes6 gene is represented by a single box; however, hes6 actually comprises four exons. (B) Injection of the CHORI73-20O6 BAC EGFP reporter at a concentration of 10 ng/µl induced EGFP signals in the PSM and tailbud regions at the 6-somite stage; lateral view. (C) Dissection of the flanking genomic region of hes6 from the CHORI73-20O6 EGFP BAC reporter via BAC homologous recombination. The genomic regions encompassed by the deleted BAC clones are indicated at the right of each bar. Each modified BAC clone was injected into embryos at a concentration of 10 ng/µl and the presence of the EGFP signal in the PSM and tailbud was examined at the 10–15-somite stage. (D) Deletion analyses of the intergenic region between hes6 and per2. Each genomic DNA was isolated and inserted upstream of the hsp70l-EGFP reporter. The constructed plasmids were injected into embryos at a concentration of 10 ng/µl. Enhancer activities in the PSM and tailbud were examined at the 10–15-somite stage. (E) The 1.7-kb DNA fragment, located 2.8-kb downstream of the hes6 translation initiation site, was inserted upstream of the hsp70l-EGFP reporter. Injection of this EGFP reporter gene at a concentration of 10 ng/µl produced specific EGFP signals in the PSM and tailbud at the 16-somite stage. Scale bars in B and E are 200 µm. |
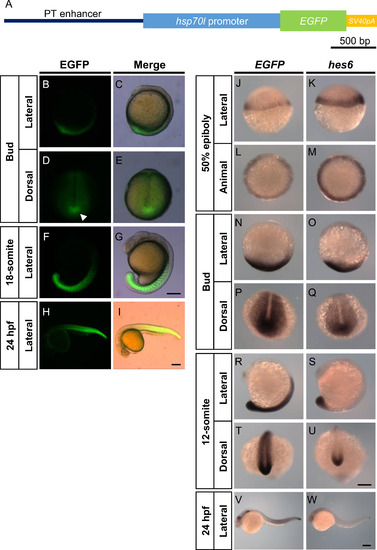
The PT enhancer-EGFP reporter drives expression in the somites, PSM, and tailbud in transgenic embryos. (A) Reporter gene used to generate the transgenic fish line Tg(hes6:EGFP-SV40pA). The identified 1.7-kb region (PT enhancer) was inserted upstream of the promoter of hsp70l, EGFP gene, and SV40pA. (B–I) EGFP signals in Tg(hes6:EGFP-SV40pA) embryos during development. EGFP expression was initiated in the tailbud at the bud stage. The arrowhead in D indicates the posterior end of the notochord in the tailbud. During somitogenesis, EGFP signal was observed in the somites, PSM, and tailbud. (J–W) Comparisons of EGFP reporter expression with endogenous distribution of hes6 mRNA in Tg(hes6:EGFP-SV40pA) embryos. Whole-mount in situ hybridization was performed using either EGFP or hes6 antisense probes. Scale bars, 200 µm. |
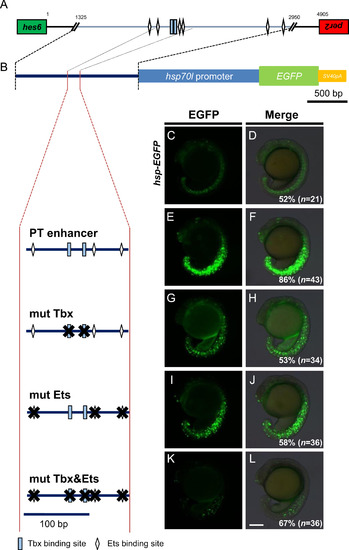
Binding sites of T-box and Ets transcription factors are required for transcriptional regulatory activities of the PT enhancer. (A) Cluster of putative T-box and Ets transcription factor binding sites in the PT enhancer identified using the Patch 1.0 program. Rectangles represent T-box binding motifs. Diamonds indicate putative Ets binding sites. The green box represents the last exon of hes6, whereas the red box is the last exon of per2. The orientation of transcription in hes6 and per2 is the tail-to-tail opposite in zebrafish. The numbers shown above the bar indicates the base pair distance from the first intergenic sequence between hes6 and per2. (B) The mutations introduced into the T-box and/or Ets binding sites in the PT enhancer ligated to the hsp70l->EGFP reporter (shown at top) are shown at left. Several mutated reporter genes were injected into fertilized eggs at a concentration of 10 ng/µl and the EGFP signals in the PSM and tailbud were examined at the 15–18-somite stage, shown at right. The percentage of embryos showing the expression patterns of EGFP shown in the panels relative to those of injected normal embryos (n) is shown at the bottom-right of each panel. All images were taken at the same magnification. Scale bar, 200 µm. |
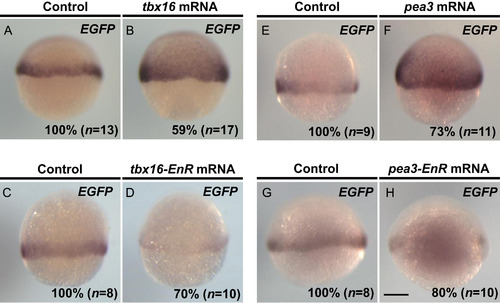
Enhancer activities of the PT enhancer were regulated by T-box and Ets transcription factors in zebrafish embryos. (A, B) tbx16 mRNA at a concentration of 200 ng/µl was injected into fertilized embryos produced by crossing Tg(hes6:EGFP-SV40pA) and wild type fish. EGFP expression was determined by whole-mount in situ hybridization at 60% epiboly. (C, D) Injection of tbx16-EnR mRNA at a concentration of 100 ng/µl in Tg(hes6:EGFP-SV40pA) embryos. EGFP expression was determined by whole-mount in situ hybridization at 60% epiboly. (E, F) Injection of wild type pea3 mRNA at a concentration of 100 ng/µl in the Tg(hes6:EGFP-SV40pA) embryos. (G, H) Injection of pea3-EnR mRNA at a concentration of 100 ng/µl reduced expression of EGFP mRNA. EGFP expression was examined by whole-mount in situ hybridization at 60% epiboly. In all panels, lateral view. The percentage of embryos showing the expression patterns of EGFP shown in the panels relative to those of injected EGFP-positive embryos (n) is shown at the bottom-right of each panel. All images were taken at the same magnification. Scale bar, 200 µm. |
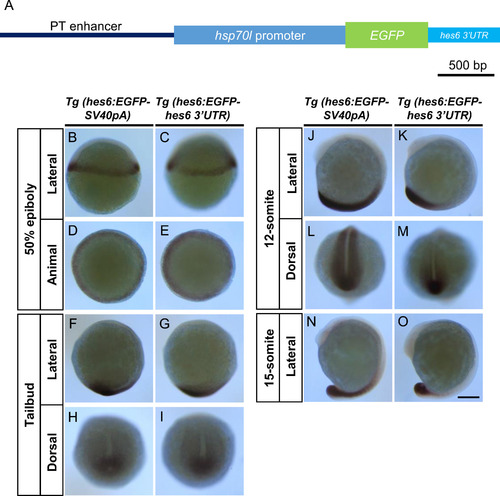
PT enhancer with hes6 3′UTR restricted the EGFP mRNA expression to the PSM. (A) EGFP reporter genes were used to generate the transgenic fish lines, Tg(hes6:EGFP-hes6 3′UTR). To generate the reporter gene used in Tg(hes6:EGFP-hes6 3′UTR), a DNA fragment corresponding to SV40pA in the reporter (shown in Fig. 2A) was replaced with hes6 3′UTR (474 bp). (B–O) Comparisons of EGFP mRNA distributions between Tg(hes6:EGFP-SV40pA) and Tg(hes6:EGFP-hes6 3′UTR) embryos. Scale bar, 200 µm. |
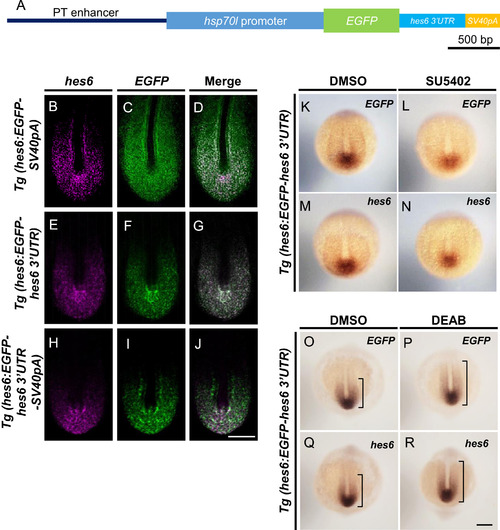
PT enhancer with 3′UTR of hes6 recapitulated a posterior-to-anterior gradient of hes6 expression within the PSM. (A) EGFP reporter genes were used to generate the transgenic fish lines, Tg(hes6:EGFP-hes6 3′UTR-SV40pA). To generate the reporter gene used in Tg(hes6:EGFP-hes6 3′UTR-SV40pA), a DNA fragment corresponding to hes6 3′UTR was inserted between EGFP and SV40pA in the reporter gene (shown in Fig. 2A). (B–J) Two-color fluorescent in situ hybridization. Tg(hes6:EGFP-SV40pA), Tg(hes6:EGFP-hes6 3′UTR), and Tg(hes6:EGFP-hes6 3′UTR-SV40pA ) embryos were fixed at the 10–12-somite stage. Confocal images were taken of flat-mounted embryos after yolk removal. Endogenous expression of hes6 is shown by magenta, and expression of EGFP mRNA is shown by green. Antisense probe for hes6 is specific to the open reading frames of hes6. Scale bar in J, 50 µm. (K–R) Expression of EGFP-hes6 3′UTR mRNA was observed in transgenic embryos after treatment with SU5402 and DEAB; expression was similar to the endogenous expression of hes6 mRNA. (K–N) Transient treatment of Tg(hes6:EGFP-hes6 3′UTR) embryos at the 1–2-somite stage with SU5402. EGFP expression was analyzed. (O–R) Treatment of Tg(hes6:EGFP-hes6 3′UTR) embryos from the sphere stage with DEAB. Embryos were fixed at the 10–12-somite stage and EGFP expression was examined. Dorsal views (K–R). Probes used for staining are shown at top-right of each panel. All images were taken at the same magnification. Scale bar in R is 200 µm. |
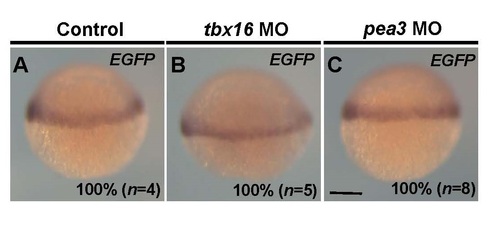
Expression patterns of EGFP mRNA in the tbx16 MO- or pea3 MO-injected embryos. (A-C). Whole-mount in situ hybridization at 60% epiboly. MO specific to tbx16 was injected into the fertilized embryos of Tg(hes6:EGFP-SV40) at a concentration of 1.0 µg/µl. MO specific to pea3 at a concentration of 2.0 µg/µl. Lateral views. The percentage of embryos showing the expression patterns of EGFP shown in the panels relative to those of injected EGFP-positive embryos (n) is shown at the bottom-right of each panel. All images were taken at the same magnification. Scale bar, 200 µm. |
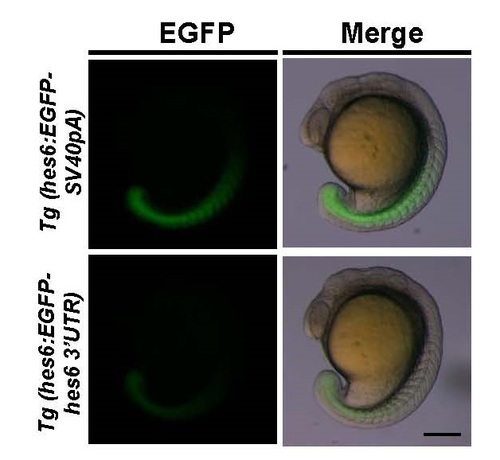
Comparisons of EGFP fluorescent signals between Tg(hes6:EGFP-SV40pA) and Tg(hes6:EGFP-hes6 3′UTR) at the 18-somite stage. Lateral views. Scale bar, 200 µm. |
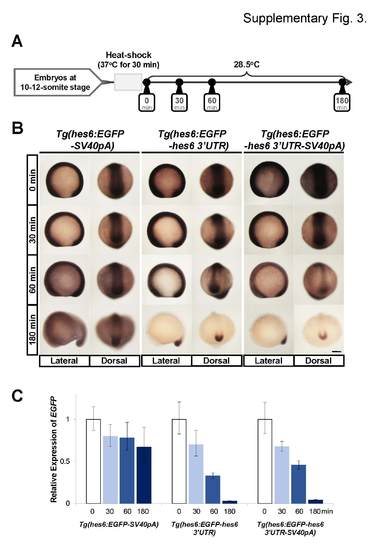
Comparisons of mRNA decay between EGFP-SV40pA, EGFP-hes6 3′UTR,, and EGFP hes6 3′UTR-SV40pA mRNAs induced by the heat-shock treatments on the transgenic embryos. (A) Schematic representation of heat-shock experiments. In the transgenic lines used in this study, the heat shock promoter, hsp70l, was used as a basal promoter for the reporter gene (Fig. 2A, 6A, and 7A), and the reporter gene could be ubiquitously induced by heat-shock treatments. To induce the EGFP mRNAs, heat-shock treatment was carried out for 30 min at 37°C on 10–12-somite stage embryos. After heat-shock treatment, embryos were incubated at 28.5°C and analyzed at 0 min, 30 min, 60 min, and 180 min. (B) Representative images of EGFP mRNA expression patterns induced by heat-shock treatment. Whole-mount in situ hybridization was performed using EGFP antisense probe. All images were taken at the same magnification. Scale bar, 200 µm. (C) Quantitative PCR to examine the decay of EGFP mRNA induced by heat-shock treatment. EGFP mRNA levels were normalized with zebrafish EF1α levels. Error bar represents the standard deviation. |
Reprinted from Developmental Biology, 409(2), Kawamura, A., Ovara, H., Ooka, Y., Kinoshita, H., Hoshikawa, M., Nakajo, K., Yokota, D., Fujino, Y., Higashijima, S.I., Takada, S., Yamasu, K., Posterior-anterior gradient of zebrafish hes6 expression in the presomitic mesoderm is established by the combinatorial functions of the downstream enhancer and 3'UTR, 543-54, Copyright (2016) with permission from Elsevier. Full text @ Dev. Biol.