
- Title
-
Iroquois Proteins Promote Skeletal Joint Formation by Maintaining Chondrocytes in an Immature State
- Authors
- Askary, A., Mork, L., Paul, S., He, X., Izuhara, A.K., Gopalakrishnan, S., Ichida, J.K., McMahon, A.P., Dabizljevic, S., Dale, R., Mariani, F.V., Crump, J.G.
- Source
- Full text @ Dev. Cell
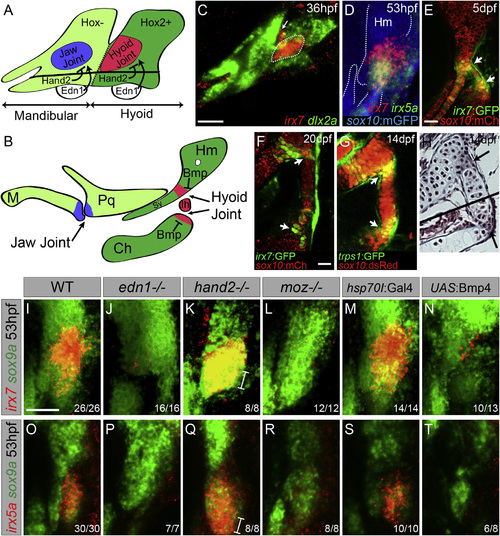
Regulation of irx7 and irx5a Expression and Character of the Hyoid Joint (A and B) Schematics of mandibular and hyoid arches at 36 hpf and cartilage derivatives at 5 dpf show early regulation of joints by Hand2 and Edn1 and late regulation by Bmp signaling. (C) In situ hybridization at 36 hpf shows expression of irx7 (red) relative to dlx2a+ neural-crest-derived cells (green) in a domain of intermediate hyoid arch cells (dashed line) and in a portion of the first pharyngeal pouch (arrow). (D) Relative to sox10:GFPCAAX+ cartilages (anti-GFP, blue), overlapping expression of irx7 (red) and irx5a (green) is seen at the developing hyoid joint. (E and F) An irx7:GFP gene-trap line (green) shows increasingly restricted expression at the bipartite hyoid joint (arrows) relative to sox10:mCherryCAAX+ cartilages (red). (G) trps1:GFP labels a similar population of cells as irx7 at each side of the hyoid joint (arrows) relative to sox10:dsRed+ cartilages. (H) Trichrome staining shows that cells at the hyoid joints (arrows) are smaller and lack the large lacunae of neighboring hypertrophic chondrocytes. Black line denotes merging of two adjacent sections. (I–T) Expression of irx7 and irx5a (red) relative to sox9a+ hyoid chondrocytes (green) in edn1, hand2, and moz mutants, as well as hsp70I:Gal4 control and hsp70I:Gal4; UAS:Bmp4 embryos subjected to 40–44 hpf heat shock. Brackets show ventral expansion in hand2 mutants. M, Meckel’s; Pq, palatoquadrate; Sy, symplectic; Hm, hyomandibula; Ch, ceratohyal; Ih, interhyal. Numbers indicate proportion of animals showing the displayed phenotype. Scale bars represent 30 µM. See also Figure S1. EXPRESSION / LABELING:
PHENOTYPE:
|
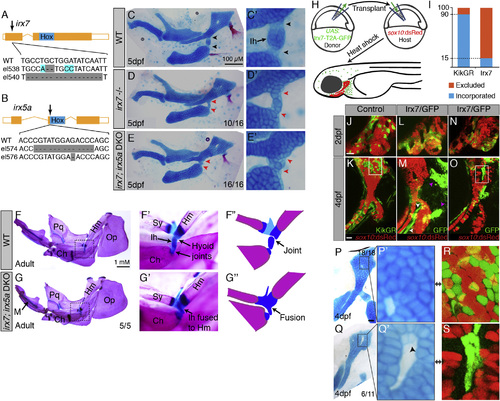
Requirements of Irx7 and Irx5a in Hyoid Joint Formation (A and B) Schematics of irx7 and irx5a TALEN mutants show the position of out-of-frame deletions (arrows) relative to homeobox domains (blue boxes). (C–E) Lateral views of mandibular and hyoid skeletons (left) and magnified views of the hyoid joints (right) show cartilages (Alcian Blue) and bones (Alizarin Red) at 5 dpf. In WT, hyoid joint cells on either side of the Ih cartilage stain poorly with Alcian (black arrowheads). In irx7el538 and irx7el538; irx5ael574 mutants, the hyoid joint is dysmorphic with increased Alcian reactivity (red arrowheads). (F and G) Dissected adult zebrafish facial skeletons (3-months post-fertilization; size matched). The hyoid joint (dashed box) is magnified in (F′) and (G′) and schematized in (F′′) and (G′′) to show joint fusions in irx7el538; irx5ael574 double mutants. Op, opercular bone. (H) Scheme of neural crest transplants followed by 30–34 hpf heat shocks to induce donor transgene expression. (I) Whereas control kikGR-expressing cells contributed to hyoid cartilage in 18 of 20 cases, Irx7/GFP-expressing cells contributed to cartilage in only 11 of 72 cases (Fisher′s exact two-tailed test, p < 0.0001). (J–O) sox10:dsRed hosts received either control hsp70I:Gal4; UAS:kikGR or hsp70I:Gal4; UAS:Irx7-T2A-GFP donor neural crest precursors. Imaging at 2 dpf revealed contribution of donor cells to the mandibular and hyoid arches, and re-imaging at 4 dpf revealed contributions to sox10:dsRed+ hyoid cartilage. Arrowheads indicate contribution of Irx7/GFP-expressing cells to ligaments (white) and bones (magenta). (P–S) Cell-specific loss of Alcian reactivity is seen in donor cells expressing Irx7/GFP (magnified in Q&prime& S is boxed region from O) but not kikGR (magnified in P′; R is boxed region from K). Numbers indicate proportion of animals showing the displayed phenotype. Scale bars represent 20 µM unless otherwise noted. See also Figure S2. PHENOTYPE:
|
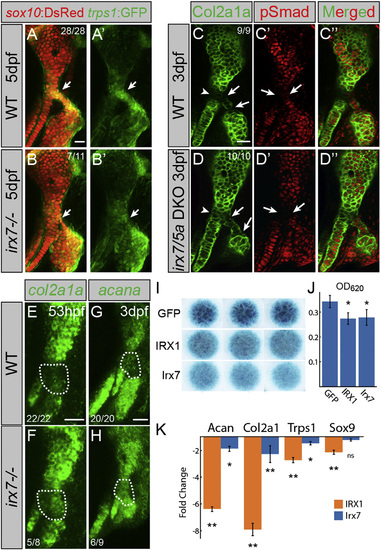
Irx7 Represses Chondrocyte Maturation (A and B) trps1:GFP (green) is reduced at the hyoid joint (arrows) of irx7el538 mutants compared with WT siblings. sox10:dsRed labels hyoid cartilages (red). (C and D) Immunostaining shows increased Col2a1a protein (green) but no change in phospho-Smad1/5/8 (red) in the hyoid joints (arrows) and Hm-Sy connecting zone (arrowheads) of irx7el538; irx5ael574 mutants relative to WT siblings. (E–H) In situ hybridization shows increased expression of col2a1a and acana in the hyoid joint region (dashed areas) of irx7el538 mutants relative to WT siblings. Numbers indicate proportion of animals showing the displayed phenotype. Scale bars represent 20 µM. (I) Irx7 and murine IRX1 (but not GFP control) inhibit Alcian+ matrix accumulation in micromass cultures of ATDC5 cells grown in chondrogenic media for 7 days. Results were consistent across biological triplicates. (J) Alcian blue content of the micromasses quantified by absorbance at 620 nm. (K) qRT-PCR on RNA extracted from micromass cultures of ATDC5 cells grown in chondrogenic media for 7 days. Compared with GFP-expressing controls, expression of Col2a1, Acan, and Trps1 was reduced by IRX1 and Irx7 misexpression. Sox9 expression was reduced by IRX1 but not Irx7 misexpression. Error bars represent 95% confidence interval of the mean. p < 0.05 and p < 0.01 using Tukey HSD test. See also Figure S3. PHENOTYPE:
|
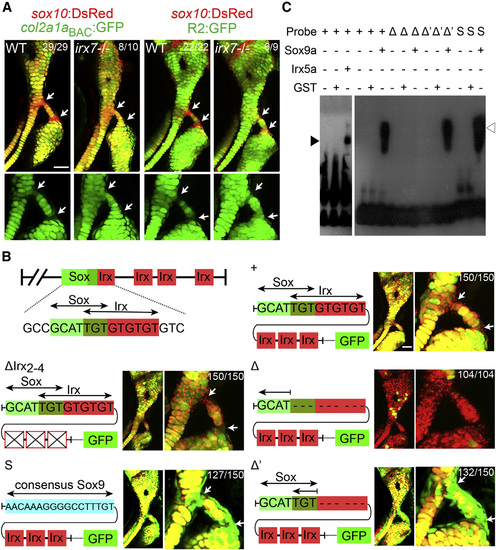
Irx Genes Directly Repress a col2a1a Enhancer (A) Relative to sox10:dsRed+ chondrocytes (red), col2a1aBAC:GFP, and R2:GFP transgenes (green) show increased col2a1a-driven expression in hyoid joint cells (arrows) of irx7el538 mutants compared with WT siblings. (B) Schematics show predicted Sox and Irx binding sites within the R2 enhancer of the col2a1a gene, as well as modified transgenic constructs. Confocal images at 6 dpf show the connection of the hyosymplectic and ceratohyal cartilages, with magnified images showing the bipartite hyoid joints (arrows). In all panels, the WT col2a1aBAC:mCherry-NTR transgene (red) displays lower levels in hyoid joints cells than neighboring chondrocytes. Transgenes with WT or modified R2 enhancers driving GFP are shown in green. Both the WT R2 enhancer and a version missing the second through fourth putative Irx sites are similar to WT col2a1aBAC:mCherry-NTR in being excluded from joints (yellow reflects overlap). Loss of the overlapping Sox/Irx site of the R2 enhancer abolishes most cartilage expression (red), and replacement with a Sox9 consensus site or deletion of just the Irx half-site results in ectopic joint expression (green). In the case of R2 enhancer missing the overlapping Sox/Irx site (Δ) 104 animals injected with the plasmid show similar expression and out of 30 founders screened, none showed more than just a sparse GFP expression in a few cartilage cells. For other panels experimental numbers are pooled for three independent stable transgenic lines. 50 embryos were examined for each line. Numbers indicate the proportion of animals showing the displayed phenotype. Scale bars represent 30 µM. (C) An electrophoretic mobility shift assay shows binding of Irx5a (closed arrowhead) and Sox9a (open arrowhead) but not a control GST protein to a probe containing the wild-type Sox/Irx site (+). Sox9a binds a probe deleted for the Irx half-site (Δ′) but not the entire Sox/Irx site (Δ), and binding is restored by replacement of the Sox/Irx site with a consensus Sox9 binding site (S). See also Figure S4. |
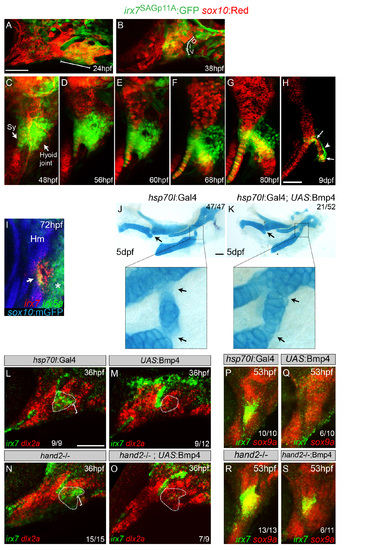
Progressive restriction of irx7:GFP to the hyoid joint and Hand2-independent inhibition of irx7 expression by Bmp signaling. (A-H) Confocal projections of the mandibular and hyoid arches at 24 (A), 38 (B), and 48 hpf (C) and the hyoid cartilages at 56 hpf onwards (D-H). sox10:mCherryCAAX (24, 48, 56, and 80 hpf and 9 dpf) and sox10:dsRed (38, 60, and 68 hpf), collectively abbreviated as “sox10:Red”, mark neural-crest-derived arch mesenchyme and later chondrocytes in red. The SAGp11A line is an insertion of a GFP-containing retrotransposon into the second exon of the irx7 gene. irx7-driven GFP expression is seen weakly throughout the hyoid arch at 24 hpf (A) and then becomes refined to the intermediate domain of the hyoid arch by 38 hpf (B). Expression then increases in the hyoid joint and adjacent symplectic cartilage region by 48 hpf (C). At later times, GFP expression persists around the hyoid joint but is gradually lost in the growing symplectic cartilage (D-G). In mid-stage larvae (9 dpf), GFP is highly restricted to chondrocytes at either end of the bipartite hyoid joint (arrows), as well as in perichondral cells (arrowhead) lining the joint (H). (I) At 72 hpf, relative to sox10:GFPCAAX+ cartilages (anti-GFP, blue), overlapping expression of irx7 (red) and irx5a (green) is seen at the developing hyoid joint (arrow). irx5a is also expressed in posterior hyoid arch cells (asterisk). (J,K) Alcian blue labeling of cartilage in control hsp70I:Gal4 and hsp70I:Gal4; UAS:Bmp4 animals subjected to a heat shock from 40-44 hpf. Misexpression of Bmp4 at this stage causes joint fusions (arrows, see magnification of hyoid joint) in the absence of the large-scale dorsoventral patterning defects caused by earlier (20-24 hpf) induction of Bmp4 (Zuniga et al., 2011). (L-O) Control hsp70I:Gal4 (L), hsp70I:Gal4; UAS:Bmp4 (M), hand2-/- (N), and hand2-/-; hsp70I:Gal4; UAS:Bmp4 (O) embryos subjected to a heat shock from 20-24 hpf. In situ hybridization shows ventral expansion (brackets) of irx7 expression in hand2-/- embryos, and loss of hyoid joint expression (dashed polygons) upon Bmp4 misexpression in both wild-type and hand2 mutant backgrounds. As a reference, dlx2a expression labels mandibular and hyoid arch mesenchyme in red. (P-S) Control hsp70I:Gal4 (P), hsp70I:Gal4; UAS:Bmp4 (Q), hand2-/- (R), and hand2-/-; hsp70I:Gal4; UAS:Bmp4 (S) embryos subjected to a heat shock from 40-44 hpf. In situ hybridization shows ventral expansion of irx7 expression in hand2-/- embryos, and loss of hyoid joint expression upon Bmp4 misexpression. Loss of hand2 partially restores some irx7 expression upon Bmp4 misexpression, suggesting that Bmp4 may act through both Hand2 and other effectors at this later stage. As a reference, sox9a expression labels newly forming chondrocytes in red. D, dorsal; I, intermediate; V, ventral; Hm, hyomandibula. Numbers indicate proportion of animals showing the displayed phenotype. Scale bars = 50 µM. |
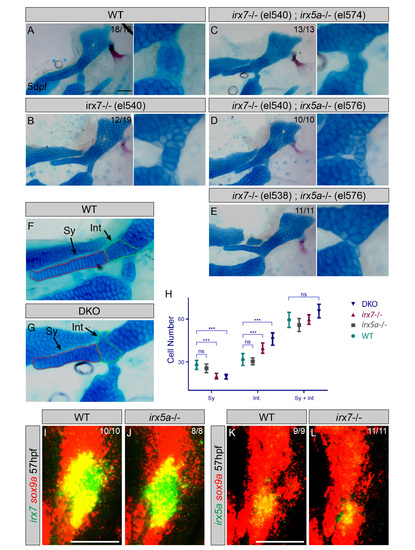
Hyoid joint and symplectic cartilage defects in independent null alleles for irx7 and irx5a. (A-E) Lateral views of hyoid skeletons (left) and magnified views of hyoid joints (right) show cartilages (Alcian Blue) and bones (Alizarin Red) at 5 dpf. Similar to the irx7el538 allele (Figure 2D), an independent irx7el540 allele shows fusions of the hyoid joint (B). All allelic combinations of irx7el538 or irx7el540 with irx5ael574 or an independent irx5ael576 allele show fully penetrant hyoid joint defects (compare C-E to Figure 2E). (F,G) Lateral views of dissected hyoid joints and symplectic cartilage (Sy, red dashed line) in irx7el538; irx5ael574 double knock-outs (DKO) and wild-type siblings. The intermediate region between the symplectic and hyomandibular cartilages (Int, green dashed line) was outlined based on the cell shape and stacking difference from the symplectic and hyomandibula proper. (H) Average cell counts in the Sy, Int, and combined Sy + Int regions are plotted. There were fewer cells in Sy and more cells in Int in irx7el538 and irx7el538; irx5ael574 DKO embryos compared to wild types, yet no differences in the combined numbers of cells. Cell counts were indistinguishable between wild types and irx5ael574 animals for all categories. n numbers: 8 wild type, 8 irx5a-/-, 16 irx7-/-, and 15 DKO; means are shown with 95% CI bars; *** = significant with α<0.05 using Tukey-Kramer HSD test; ns = not statistically significant. (I-L) In situ hybridization at 57 hpf shows expression of irx7 and irx5a (green) relative to sox9a+ cartilages (red). irx7 expression is unaffected in irx5ael574 mutants, and irx5a expression is unaffected in irx7el538 mutants. Thus, at least at the level of irx7 and irx5a, there is no genetic compensation in the respective mutants. Numbers indicate proportion of animals showing the displayed phenotype. Scale bar = 50 µM. |
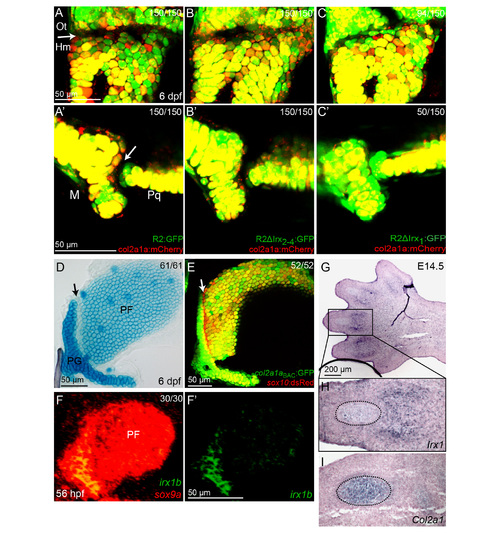
Potential roles of Irx genes at multiple joints. (A-C) Modified R2 enhancer transgenes (green) are shown relative to a wild-type col2a1aBAC:mCherry-NTR transgene (red) which labels chondrocytes but is excluded from joints (arrows). Compared to the control wild type R2 (A,A′), expression from an R2 enhancer lacking the first Irx site is expanded into the hyomandibula – (Hm) otic capsule (Ot) joint (C) and jaw joint (C′). In contrast, loss of the second through fourth Irx sites has no effect on R2 enhancer expression at these joints (B,B′). Experimental numbers are pooled for three independent stable transgenic lines. 50 embryos were examined for each line. M, Meckel’s lower jaw cartilage; Pq, palatoquadrate upper jaw cartilage. (D-F) The joint between the pectoral fin (PF) and pectoral girdle (PG) shares some of the features of the hyoid joint. At 6 dpf, cells within the pectoral fin joint stain poorly with Alcian Blue relative to surrounding chondrocytes (D, arrow). The pectoral fin joint (arrow) also expresses much lower levels of col2a1aBAC:GFP relative to surrounding chondrocytes, while sox10:dsRed (red) uniformly labels chondrocytes (E). At 56 hpf, irx1b is expressed within precursors of the pectoral fin joint (F). sox9a expression (red) labels early chondrocytes at this stage. Numbers indicate proportion of animals showing the displayed phenotype. (G-I) in situ hybridization shows expression of Irx1 in the digit joints in an E14.5 mouse hindpaw. Magnifications of adjacent sections (H,I) show that Irx1 and Col2a1 are expressed in a largely mutually exclusive pattern, with Col2a1 but not Irx1 marking cartilage condensations (dashed lines). Serial sections of 2 animals gave similar results. |
Reprinted from Developmental Cell, 35, Askary, A., Mork, L., Paul, S., He, X., Izuhara, A.K., Gopalakrishnan, S., Ichida, J.K., McMahon, A.P., Dabizljevic, S., Dale, R., Mariani, F.V., Crump, J.G., Iroquois Proteins Promote Skeletal Joint Formation by Maintaining Chondrocytes in an Immature State, 358-65, Copyright (2015) with permission from Elsevier. Full text @ Dev. Cell