
- Title
-
Asymmetric cell convergence-driven fin bud initiation and pre-pattern requires Tbx5a control of a mesenchymal Fgf signal
- Authors
- Mao, Q., Stinnett, H.K., Ho, R.K.
- Source
- Full text @ Development
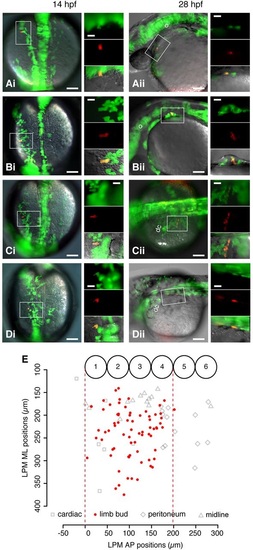
A single-cell-resolution fate map of the pectoral fin-field in the zebrafish LPM. (Ai) Dorsal view of 14hpf embryo previously injected with Kaede RNA in a single blastomere. Box shows a single cell photo-converted to express red fluorescence. Insets show the boxed region at higher magnification of green Kaede fluorescence (upper), red photo-converted cell (middle) and overlaid fluorescence with differential interference contrast microscopy (bottom). (Aii) Same embryo in lateral view at 28hpf. Box shows resultant clone in cardiac region; insets are as in Ai. (Bi,Bii) Fin bud clone. (Ci,Cii) Peritoneum clone. (Di,Dii) Midline clone. Scale bars: 100µm in overviews; 10µm in insets. (E) Fate map of LPM cell fates at 14hpf. x-axis: AP position relative to somite borders. y-axis: ML position from midline of embryo. Numbered circles denote somite positions. Red dashed lines delineate the fin-field at 14hpf. dc, duct of Cuvier; ML, mediolateral; o, otic vesicle. |
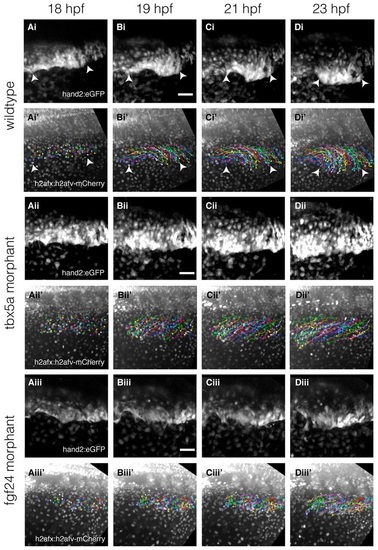
Time-lapse and cell tracking of the fin-field LPM during pectoral fin bud initiation in wild-type embryos and Tbx5a and Fgf24 morphants. (Ai-Diii′) Time-lapse of double transgenic Et(hand2:eGFP)ch2; Tg(h2afx:h2afv-mCherry)mw3 embryos with backgrounds of wild-type embryos (Ai-Di2), Tbx5a morphant (Aii- Dii′) and Fgf24 morphant (Aiii-Diii′). (Ai-Di,Aii-Dii,Aiii-Diii) Time-lapse stills showing convergence over time of eGFP-expressing fin-field cells. (Ai′-Di′,Aii′-Dii′,Aiii′-Diii′) Corresponding stills of mCherry-labeled nuclei overlaid with cell trajectories indexed by random colors. Dorsal view, anterior left. Scale bars: 50µm. Arrowheads in Ai′-Di′ highlight the extent of the fin-field. |
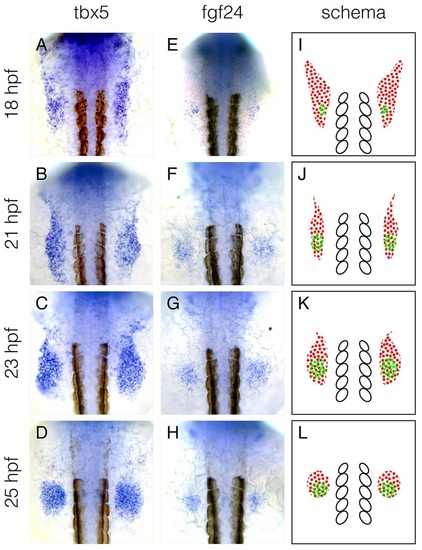
The mRNA expression pattern of fgf24 overlaps with the posterior domain of tbx5a expression. (A-H) mRNA expression pattern of tbx5a (A-D) and fgf24 (E-H) at 18, 21, 23 and 25hpf. (I-L) Schematics of mRNA expression patterns of tbx5a (red dots) and fgf24 (green dots), highlighting the overlap between tbx5a and fgf24 mRNA expression at the posterior limb-field. White ovals denote somites 1-5. Dorsal view, anterior up. |
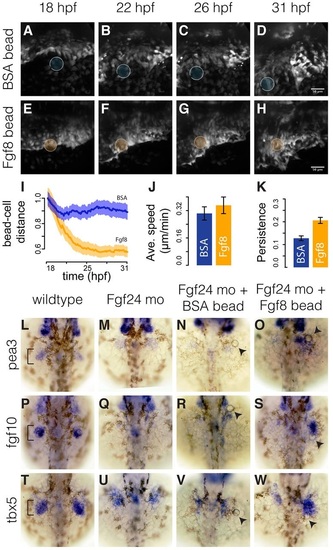
Fin-field LPM cells in Fgf24 morphants can converge towards Fgf8b-coated beads. (A-H) Stills from time-lapse of Fgf24 morphant embryos implanted with either a BSA-coated bead (A-D) or an Fgf8b-coated bead (E-H). Scale bars: 50 µm. (I) Temporal progression of relative distances of tracked cells to implanted BSA- or Fgf8b-coated beads. Solid lines show eight-embryo average. Shaded areas show eight-embryo 95% confidence interval. n=20 tracks per embryo. (J,K) Average speed (J) and persistence (K) of tracked cells in Fgf24 morphant embryos with BSA- or Fgf8b-coated beads. Error bars show eight-embryo 95% confidence interval. (L-W) Dorsal views of fin bud region (brackets) in 36hpf embryos showing pea3 (L-O), fgf10 (P-S) and tbx5a (T-W) expression in wild types, Fgf24 morphants, Fgf24 morphants with a BSA-coated bead and Fgf24 morphants with an Fgf8b-coated bead. Arrowheads point to implanted beads. |
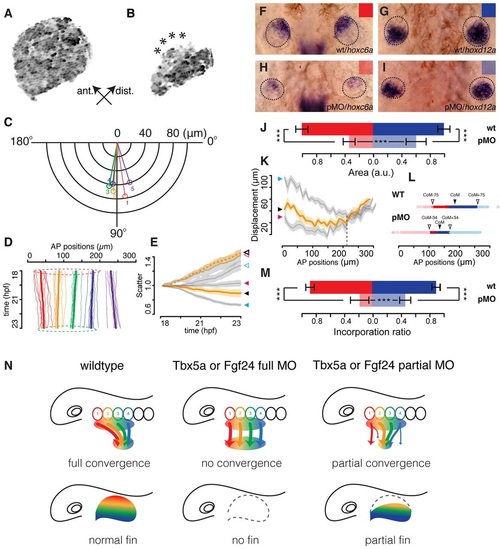
Incomplete cell convergence in the fin-field of Tbx5a partial morphants is correlated with anteriorly biased truncations in fin buds. (A,B) Maximal intensity projections of the pectoral cartilaginous disc in 4dpf Tg(b-act2:Brainbow1.0L)pd49 larvae of an otherwise wild-type embryo (A) and a Tbx5a partial morphant (B); asterisks highlight lesions on the anterior edge of the cartilaginous disc. (C) Polar plot showing net average orientation and magnitude of displacement of the five track groups in eight Tbx5a partial morphant embryos. (D) Average net AP trajectories of five track groups relative to the overall trajectories in all LPM tracks in eight Tbx5a partial morphant embryos. Dashed circles highlight the similar AP extent of fin-field domains between 18 (red) and 23hpf (green). (E) Scatter values in eight wild-type embryos (blue arrowhead), eight Tbx5a full morphants (pink arrowhead) and eight Tbx5a partial morphants (black arrowhead). Solid arrowhead represents fin-field; open arrowhead represents peritoneum field. Lines represent eight-embryo average; shaded areas represent 95% confidence interval. (F-I) Expression patterns of hoxc6a (F,H) and hoxd12a (G,I) in the 36hpf fin buds of wild-type (wt; F,G) and Tbx5a partial morphant (pMO) embryos (H,I; dorsal view, anterior up). (J) Quantification of expression areas of hoxc6a (red) and hoxd12a (blue) in wild-type embryos (dark color) and Tbx5a partial morphants (light color; n=40 each). (K) AP displacement plotted against starting AP positions in eight wild-type embryos (blue arrowhead), eight Tbx5a full morphants (red arrowhead) and eight Tbx5a partial morphants (black arrowhead). Dashed vertical line represents the rough boundary at somite 4-5 between the fin and peritoneum fields. Solid lines represent eight-embryo average; shaded areas represent eight-embryo 95% confidence interval. (L) Track ending AP positions of fin-field tracks in eight wild-type embryos (WT) and eight Tbx5a partial morphants (pMO). CoM, center of mass; CoM-75/CoM+75, anterior/posterior limits of the wild-type fin bud; CoM-34/CoM+34, anterior/posterior limits of the Tbx5a partial morphant fin bud. (M) Quantification of incorporation ratio of anterior (red, somites 1-2) and posterior (blue, somites 3-4) fin-field tracks in wild-type embryos (dark color) and Tbx5a partial morphants (light color; n=40 each). Wilcoxon test: ***P=9.1×10⁴ (A tracks wild type-Tbx5a pMO); ***P=1.6×10⁴ (P tracks wild type-Tbx5a pMO); ***P=2.7×10³ (A tracks Tbx5a pMO-P tracks Tbx5a pMO). (N) Models of fin bud initiation in various conditions. First column: in wild types, fin-field cells undergo asymmetric and topological AP convergence. Fin-field positional information (rainbow color) translates into AP axis patterning in the fin. Second column: in Tbx5a or Fgf24 full morphants, all fin-field cells fail to converge, resulting in initiation failure and absence of fins. Third column: in Tbx5a or Fgf24 partial morphants, some fin-field cells fail to converge, with anterior fin-field cells preferentially mis-migrating. Given that positional information might be specified in the early fin-field, reduced incorporation of anterior progenitors results in the anteriorly biased truncation of the fin. |