
- Title
-
Large-scale live imaging of adult neural stem cells in their endogenous niche
- Authors
- Dray, N., Bedu, S., Vuillemin, N., Alunni, A., Coolen, M., Krecsmarik, M., Supatto, W., Beaurepaire, E., Bally-Cuif, L.
- Source
- Full text @ Development
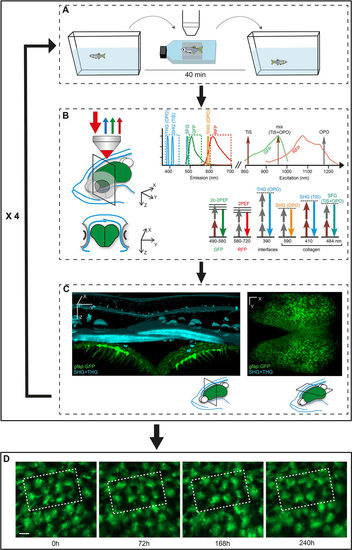
Workflow for the tracking of zebrafish pallial aNSCs in their endogenous niche over weeks. (A) The transparent double mutant fish line casper, crossed into fluorescent GFP and/or RFP backgrounds highlighting aNSCs and/or cell division events, is subjected to reiterated imaging at intervals of a few days over a period of weeks (see Fig. S2). The whole procedure (anesthesia, positioning and imaging) takes around 40min. (B) Combined multicolor fluorescence/harmonics multiphoton microscopy performed in vivo through the skin and skull (blue on the schematized fish head, left panel) down to the pallium (green) (top: lateral 3D view, bottom: cross section at the indicated plane) permits the concomitant recording of aNSCs (GFP, green arrows; RFP, red arrows) and skin/skull structures (SHG/THG harmonics, blue arrows). The combination of TiS and OPO laser excitation is schematized in the panel on the right, as well as the recorded signals (GFP, RFP, SHG, THG) and, when appropriate, the detected structure (e.g. collagen). (C) Harmonic signals revealing skin and skull morphology (blue on the 3D rendering of a thick optical cross section from an entire whole-mount imaging stack, left panel) are used to position the fish in an identical manner over the different imaging sessions. The aNSC layer (green, with processes extending into the brain parenchyma) is visible as a fluorescent signal underneath (left panel), or can be shown as a single whole-mount dorsal fluorescent recording (right panel). (D) The images recorded over consecutive sessions (repetitions of the sequence shown in A-C, e.g. here four times at a few days interval) are aligned using SHG/THG signals, followed by manual corrections using Imaris, to track individual cells over time. Dashed boxes outline the same group of cells recognizable over the consecutive time points. Scale bars: 50µm (C), 15µm (D). |
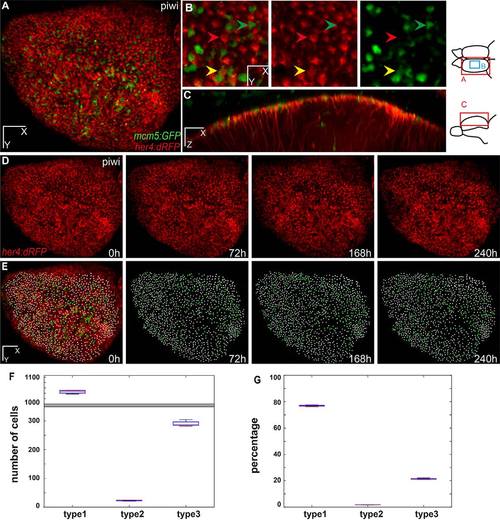
Live imaging and tracking over 10days of all adult neural stem cells across the entire pallial germinal zone. (A-C) One hemisphere of a her4:dRFP;mcm5:eGFP;casper transgenic fish (individual fish named piwi) imaged through the skin and skull. Anterior to the left. (A) Dorsal view of an entire hemisphere. (B) High magnification of a central area of the medial pallium, observed live, highlighting examples of quiescent RG (type 1), proliferating RG (type 2) and proliferating non-glial progenitors (type 3 cells) (red, yellow and green arrowheads, respectively). (C) Optical sagittal section showing the processes of the glial cells through the parenchyma. Diagrams to the right show the regions imaged for A,B and C. (D,E) Dorsal views of the pallial germinal zone in the same animal after alignment over 10days of imaging. (D) Red channel highlighting all RG cells. (E) RG cells (white dots; 1122 cells on average, s.d.=13) and proliferating cells (green dots; 290 cells on average, s.d.=9) plotted over time across the entire germinal zone (superimposed to the fluorescence image on the left panel). (F,G) Box plot of the total number (F) and percentage (G) of progenitor cells of each type, averaged over the different time points of imaging. The mean number of type 1 cells counted is 1042 (s.d.=7.6), of type 2 cells is 91 (s.d.=6.6) and of type 3 cells is 391 (s.d.=9.5). The percentages of type 1, 2 and 3 cells over all cells (type 1+2+3) are 73.5%, 5.7% and 20.6%, respectively. Scale bars: 80µm (A,D,E), 30µm (B), 50µm (C). |
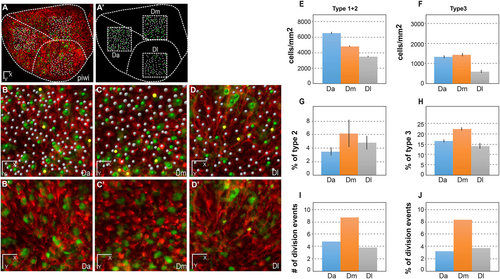
Quantitative analysis of dynamic NSC parameters in distinct domains of the pallial germinal zone (Da, Dm and Dl) in the fish named piwi. (A,A′) Live image of the pallial germinal zone showing her4:drfp-positive NSCs (red) and mcm5:egfp dividing cells (green) (A) and positioning of the three sampled subdomains (dashed squares representing a top view of the sampled cubes) (A′). Dashed lines separate the corresponding neuroanatomical domains. Anterior to the left, midline to the top. Da, anterior pallium; Dm, medial pallium; Dl, lateral pallium. Adapted from Wullimann et al. (1996). (B-D′) High magnification views of the three domains, as indicated, with (B-D) and without (B′-D′) individual cell plotting. White dots, quiescent NSCs; yellow dots, activated NSCs; green dots, dividing her4-drfp-negative progenitors. (E-H) Quantification of NSC parameters over 10days (t1-t4). All statistics are paired t-tests, with standard deviations indicated as vertical bars. The average numbers of NSCs counted for each domain per time point are 151 (Da), 109 (Dm) and 83 (Dl). (E) NSC density in each domain, measured as the total number of type 1+type 2 cells per mm2 of germinal zone surface (see Materials and Methods for the calculation of this surface taking into account the germinal zone curvature). Da versus Dm: P<0.001; Da versus Dl: P<0.0001; Dm versus Dl: P<0.0001. (F) Density of type 3 cells (non-glial proliferating progenitors), measured as the total number of type 3 cells per mm2. Da versus Dm: P<0.1; Da versus Dl: P<0.0001; Dm versus Dl: P<0.0001. (G) Proportion of activated NSCs (type 2 cells) in each domain among the total NSC population (type 1+type 2 cells). Da versus Dm: P<0.1; Da versus Dl: P<0.05; Dm versus Dl: not significant. (H) Proportion of type 3 cells among the total progenitor population (type 1+type 2+type 3 cells). Da versus Dm: P<0.001; Da versus Dl: P<0.05; Dm versus Dl: P<0.01. (I,J) Quantification of de novo NSC activation events over 7days (t2-t4) in absolute numbers (I) and in proportion of the number of RG quiescent at time t4 (J). Da versus Dm: P=0.1 (not quite significant); Da versus Dl: P=0.7, not significant; Dm versus Dl: P=0.5 (not significant); Fisher′s two-tailed test. Scale bars: 50µm (A,A′), 30µm (B-D′). |
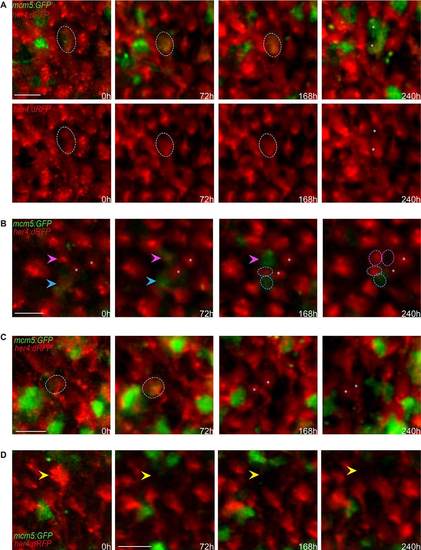
Qualitative evaluation of NSC fate over 10days across the entire pallial germinal zone. (A-D) Detailed views (dorsal) of groups of cells in a her4:dRFP;mcm5:eGFP;casper transgenic fish (individual fish named piwi) observed in vivo through the skin and skull over four time points (t1-t4) spanning 10days. (A) Example of a gliogenic (self-renewing) division with asymmetrical outcome at time t4. The circle outlines an RG cell expressing RFP and GFP on the first and following days, which divided at t4 to give rise to two daughter cells (asterisks) that maintained GFP expression but only one of which (bottom cell) expresses RFP (and harbors a process, not shown). Top panel: merged channels; bottom panels: red channel only. (B) Examples of two other gliogenic (self-renewing) divisions with asymmetrical outcome at time t4. The magenta arrowhead indicates an RG cell expressing RFP on the first day, switching on GFP at t2 and dividing at t4 to give rise to two daughter cells (circles), both non-proliferating, one expressing RFP (and harboring a process, not shown). The cyan arrowhead indicates an RG cell expressing RFP and GFP on the first and following days and dividing at t4 to give rise to two daughter cells (circles), one expressing GFP and the other RFP (and harboring a process, not shown). Asterisks indicate two quiescent cells that serve as references. (C) Example of a symmetric gliogenic division. The circle indicates an RG cell expressing RFP on the first day, then switching on GFP and dividing to give rise to two identical RFP-positive, GFP-negative (quiescent) daughter cells (asterisks). (D) Example of an RFP-positive RG cell (yellow arrowhead) losing RFP expression over the time course of analysis; this is interpreted as the cell switching fate and delaminating into the parenchyme. Scale bars: 20µm (A-D). |
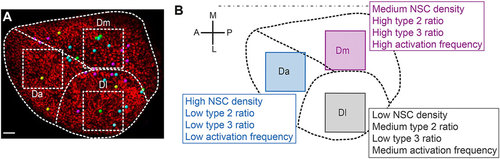
Schematic summary of the distinct NSC parameters observed across the pallial germinal zone. (A) Spatial distribution of the different types of division events completed over the imaging period (Table S2, cases 6 to 9) among 1138 tracked cells (from Fig. 4, Fig. S12). Yellow dots, symmetric gliogenic symmetric divisions; cyan dots, asymmetric gliogenic generating a RG and a ‘lost’ cell at t4; magenta dots, asymmetric gliogenic generating a RG and a proliferating progenitor at t4; green dots, symmetric with an undetermined fate of both daughters. These correspond respectively to cases 6 to 9 in Table S2. (B) Cell density and activation frequency parameters mapped in Da, Dm and Dl (from Figs 2 and 3 and Fig. S11). In both panels, one hemisphere is shown, anterior to the left. Scale bar: 50µm. |
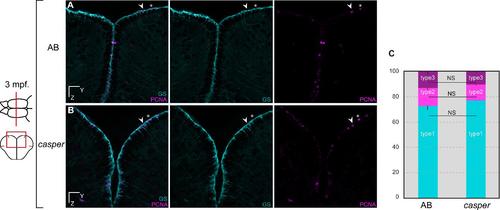
Adult casper fish1 display a normal profile of telencephalic neural progenitors. (A,B) Cross-sections of the telencephalon and immunostaining for the glial marker GS (cyan) and the proliferation marker PCNA (magenta) in the pallium of 3 month-old (mpf) (A) wild type AB and (B) casper (double homozygote for roy-/-;nacre-/-) zebrafish. (C) Quantification of non-dividing RG (type1 cells), dividing RG (type2 cells) (arrowhead) and dividing non-RG (type3 cells) (asterisk) progenitors showing no statistical differences between the two genotypes (unpaired t-test comparing the proportion of each cell type between AB and casper, P values > 0.05) (unpaired t-test for type1 cells: P value = 0.0821; for type 2 cells: P value = 0.1477; for type 3 cells: P value = 0.0974). n = 4 brains each with 3 to 6 sections per brain. Scale bars: 30 µm (A,B) |
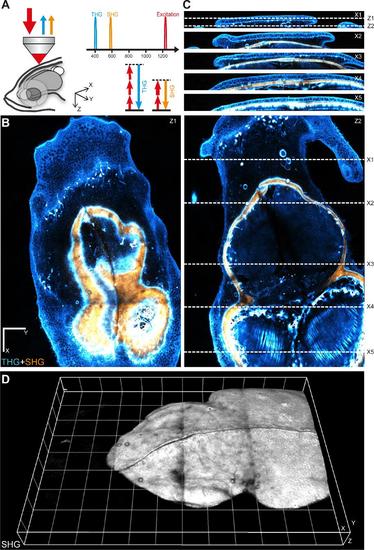
Second- and third-harmonic generation (SHG, THG) imaging of the telencephalon region in a live zebrafish adult. (A) Imaging geometry and harmonic signals optical properties. The fish (5 months) was anesthetized and held in an upright microscope. Backscattered THG and SHG signals were collected through the excitation objective. X corresponds the antero-posterior (ap) axis, Y corresponds to the left-right (lr) axis, and Z corresponds to the dorso-ventral (dv) axis. (B) Two XY images extracted from a dataset encompassing a 2380*1708*160 µm3 volume. (C) Four YZ images extracted from the same dataset. The entire dataset consists of a mosaic of 12 XYZ stacks acquired with 500µm lateral steps, each spanning a volume of 800*800*180 µm3. The global image was assembled from the raw XYZ stacks using FIJI grid stitching module. Excitation wavelength was λ=1180nm. THG signals (at λ/3) and SHG signals (at λ/2) were simultaneously detected on two independent channels. The SHG image, shown in orange, highlights fibrillar collagen and reveals the global structure of the skull. The THG image, shown in blue, highlights interfaces and heterogeneities and provides multiple structural details. In particular, THG signals reveal skin cell boundaries, blood vessels, pigmented cells, skull surface, lipidic accumulations, and myelin fibers. Scale bar, 200 µm. Voxel size 2 × 2 × 2 µm3. Time per pixel 5µs. (D) 3D rendering of the SHG data, revealing skull structure. Grid size, 200 µm. 3D rendering was calculated using Imaris (Bitplane). See also Supplementary material Movies 1, 2 and 3. |
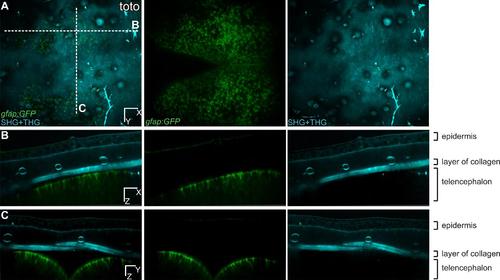
Multicolor 3D images of RG cells in the pallium and SHG/THG signals of the structures above. Dorsal (A), transversal (B) and cross (C) views for one time point of a transgenic zebrafish gfap:eGFP into a casper background (individual fish named toto). The green channel is showing all the glial cells and the processes are visible (B, C). The cyan channel is showing structures such as collagen, lipids, light-absorbing cells, and the epidermis, where individual cells are visible. The merged panel in (C) is the same as on Fig.1C. Scale bars, 50 µm (A,-C). |
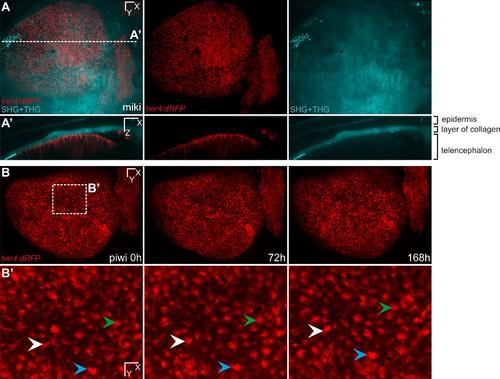
Alignment of successive z-stacks using SHG/THG signals. (A,A′) Dorsal and transversal views respectively for one time point of a transgenic zebrafish her4:dRFP into a casper background (individual fish named miki). The red channel is showing all the glial cells expressing Her4 and their processes are visible (A′). One entire hemisphere can be imaged using the 20X objective such as in (A) or two halves of each hemisphere such as in Supplementary material Fig. S3. (B,B′) Three time points of a transgenic her4:dRFP named piwi. The time points were aligned using the SHG/THG signals only (not shown here) and the RecursuveReg Imaris extension. (B′) is showing a high magnification of (B) and the three arrowheads are pointing to the same three cells over 168 hours showing that the alignment almost perfectly corrects the changes in orientation when the fish is repeatedly mounted (see also Supplementary material Movie 4). Scale bars, 50 µm (A-B), 20 µm (B′). |
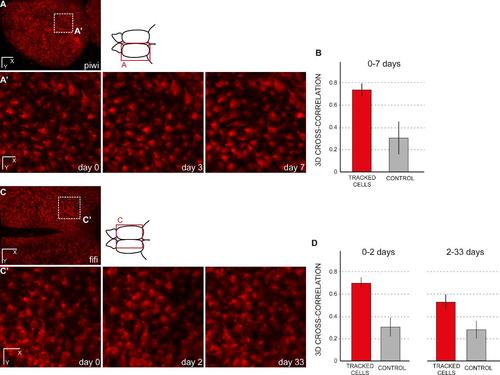
Cross-correlation of randomly chosen cells between time points. (A,A′) Dorsal general view and close up for three time points (until 7 days) of a transgenic zebrafish her4:dRFP into a casper background (individual fish named piwi). (A′) shows the result for the area boxed in A after a manual re-alignement using the drift correction in the Imaris software (Bitplane). (B) Amplitude of 3D image cross-cross correlations of 100 tracked cells between day 0 and day 3 or between day 3 and day 7. The average correlation of tracked cells is significantly higher than the control case, when the same analysis is performed after random permutation of cell positions (Welch’s test, p=1.2 10-118). (C,C′) Dorsal general view and close up for three time points (until 33 days) of a transgenic zebrafish her4:dRFP into a casper background (individual fish named fifi). (C′) shows the result for the area boxed in A after a manual re-alignement using the drift correction in the Imaris software (Bitplane). (D) Amplitude of 3D image cross-cross correlations of 11 tracked cells between day 0 and day 2 (left) and between day 2 and day 33 (right). As expected, the correlation amplitude decreases for longer delay between time points (here, from 0.70 for 2 days, to 0.53 for 31 days). However, in both cases the average correlation of tracked cells remains significantly higher than the control case, when the same analysis is performed after random permutation of cell positions (Welch’s test, p= 5.1 10-10 and p=1.7 10-7, respectively). Scale bars: 80 µm (A, C), 20 µm (A′, C′) |
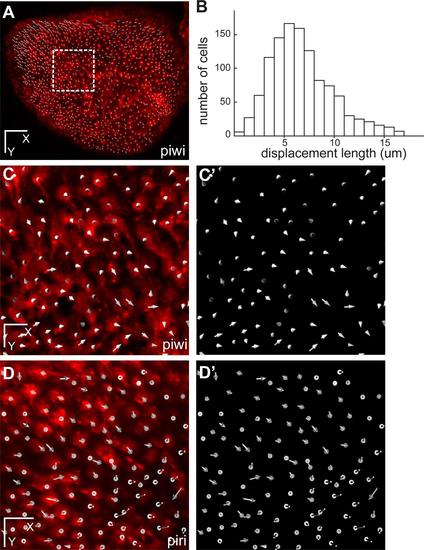
Absence of migration of pallial RG cells. (A) Dorsal view of the entire pallial germinal zone of one telencephalic hemisphere in a transgenic zebrafish her4:dRFP into a casper background (individual fish named piwi) at t=0, where all individual RG cells have been plotted (white dots, 1,122 cells). (B) Distribution of the total displacement length of each of the 1,122 cells after 7 days of imaging. The gaussian curve, with an average displacement of 6.59 µm (SD=2.4) does not reveal outlier cells (Grubbs′ test). (C,C′) Overall displacement vector of each individual cell after 7 days of imaging in the area boxed in A (C: vectors shown on top of red fluorescence –RG cells-, C′: vectors only). Note in C that the average displacement of each cell rarely exceed the size of a cell diameter. (D,D′) Same representations as (C,C′) but for an equivalent area in the individual fish named piri. Of note, in the case of a division, daughter cells, which always remain adjacent (see Fig. 2), have been plotted as a single cell. Scale bars: 80 µm (A), 20 µm (C-D′). |
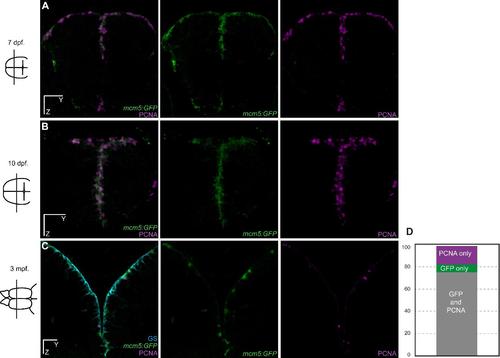
Validation of the Tg(mcm5:eGFP)gy2 transgenic line for the reliable reporting of neural progenitor cell division in the zebrafish pallium. (A-C) Cross-sections of the telencephalon are shown in transgenic zebrafish at 7 day-postfertilization (dpf), 10 dpf and 3 month-post-fertilization (mpf) with double immunostaining for the proliferation marker PCNA (magenta) and GFP (green). (D) Quantification showing that GFP is strictly co-expressed with PCNA in 75% (sem=3.1) of the positive ventricular progenitors (sum of PCNA and MCM5 cells). 17% (sem=4.0) of the positive cells express GFP only, which we interpret as cells having divided but still maintaining some GFP protein due to GFP stability. 8% (sem=1.8) of the positive cells express PCNA only, which we interpret as cell just entering the cell cycle with no GFP detectable yet. n = 4 brains each with 3 to 6 sections per brain. Scale bars: 30 µm (A-C). |
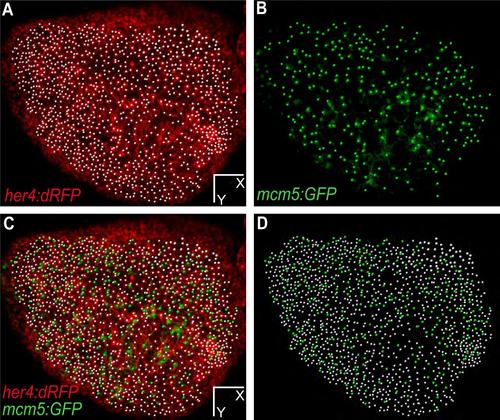
Plotting of adult neural stem cells and proliferating progenitors at time point 0 on a live image. Dorsal view of one hemisphere of a her4:dRFP;mcm5:eGFP;casper transgenic fish (individual fish named piwi) imaged at t0. (A) red channel only (RG cells) with corresponding plots (white dots), (B) green channel only (proliferating cells), (C) merged red and green fluorescence view with corresponding plots for RG (white) and proliferating progenitors (green), (D) plots only (as in Fig. 2E). Scale bars: 80 µm (A-D). |
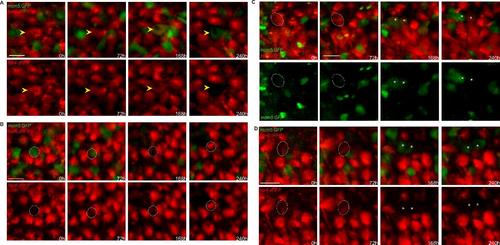
Fluctuations of her4:drfp expression preceding or following NSC division. High magnification (dorsal views) of groups of cells in a her4:dRFP;mcm5:eGFP;casper transgenic fish (individual fish named piwi) filmed live through the skin and skull over 4 time points (t1-t4) spanning 10 days. Top panels: merged channels, bottom panels: red or green channels only. (A) Example of a RG about to divide and switching off her4:drfp expression after turning on mcm5:egfp. (B) Example of a mcm5:gfp-positive cell acquiring her4:drfp expression, likely after division. (C) Additional example of an asymmetric, gliogenic (selfrenewing) division. The circle is showing a RG cell expressing RFP only on the first days, switching on mcm5:egfp and dividing at t3 and giving rise to two daughter cells (asterisks) one of which expresses RFP only (and harboring a process, not shown) (right cell) and the other maintaining GFP only (left cell). (D) Example of a symmetric division where both daughters harbor a non-glial fate at time t4. The circle surrounds the initial RG, and asterisk indicate the position of the two daughters. Scale bars: 20 µm (A-D). |