
- Title
-
Metalloprotease OMA1 Fine-tunes Mitochondrial Bioenergetic Function and Respiratory Supercomplex Stability
- Authors
- Bohovych, I., Fernandez, M.R., Rahn, J.J., Stackley, K.D., Bestman, J.E., Anandhan, A., Franco, R., Claypool, S.M., Lewis, R.E., Chan, S.S., Khalimonchuk, O.
- Source
- Full text @ Sci. Rep.
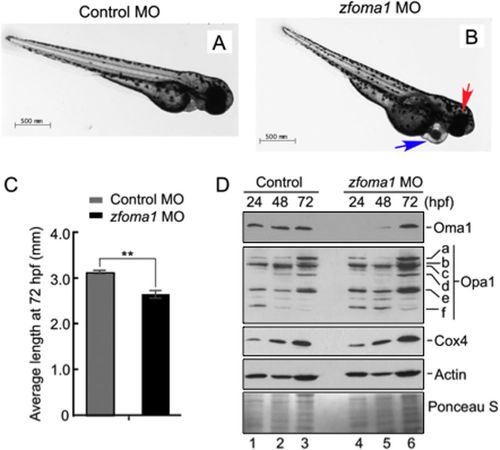
Depletion of Oma1 in fish affects development. (A,B) Representative images of larval zebrafish at 72 hours post fertilization (hpf) injected with either a standard control MO (A) or a zfoma1 MO (B). Fish injected with zfoma1 MO have smaller heads and eyes (red arrow) and defects in heart morphology (blue arrow). Bar, 500 μm. (C) Body length of control and zfoma1 morphants at 72 hpf. Average standard length was plotted ± S.E.M. (n = 6–13, **p < 0.01 by t-test). (D) Immunoblot of protein extracts from injected fish (yolk removed) at 24, 48 and 72 hpf. Expression of Oma1, Opa1 isoforms (a–f) and Cox4 (mitochondrial abundance marker) was analyzed with respective antibodies. Actin and Ponceau S staining were loading controls. Source data (full-length blots) are available online in Supplementary information. EXPRESSION / LABELING:
PHENOTYPE:
|
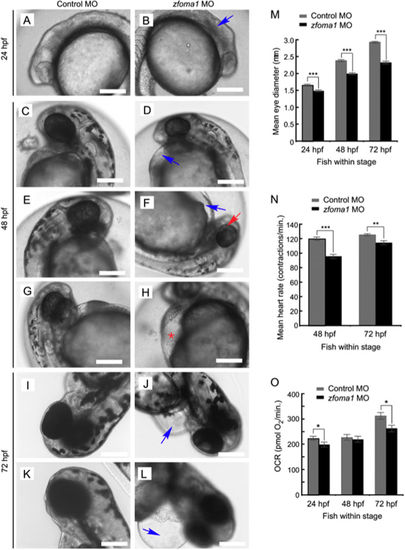
Depletion of Oma1 in fish results in specific developmental abnormalities. (A–L) At 24 hpf, zfoma1 morphants (B) lack definition of brain structures (blue arrow) compared to control MO fish (A). At 48 hpf, several abnormalities are observed in Oma1 MO-injected embryos (D,F,H). The embryos had smaller heads and eyes and often exhibited pericardial edema (blue arrow, D,F) that sometimes resulted in visible erythrocyte accumulation in the yolk sinus area (red asterisk, H). Pigmentation in the eye was partially complete compared to controls (red arrow, F). At 72 hpf, pericardial edema was extensive (blue arrow, J,L) and hearts were largely unlooped. Scale bars, 200 μm. (M) Eye size in control and zfoma1 morphants at 24, 48 and 72 hpf (n = 9–12). (N) Heart contraction rates (measured as beats per minute) in control versus Oma1-depleted fish at 48 and 72 hpf (n = 30). (O) In vivo respiration in control and Oma1 MO-treated fish embryos at 24, 48 and 72 hpf (n=10). Data are shown as mean ± S.E.M.; *p < 0.05, **p < 0.01, ***p < 0.001 zfoma1 vs. control MO (t-test). PHENOTYPE:
|