
- Title
-
Developmental alterations in centrosome integrity contribute to the post-mitotic state of mammalian cardiomyocytes
- Authors
- Zebrowski, D.C., Vergarajauregui, S., Wu, C.C., Piatkowski, T., Becker, R., Leone, M., Hirth, S., Ricciardi, F., Falk, N., Giessl, A., Just, S., Braun, T., Weidinger, G., Engel, F.B.
- Source
- Full text @ Elife
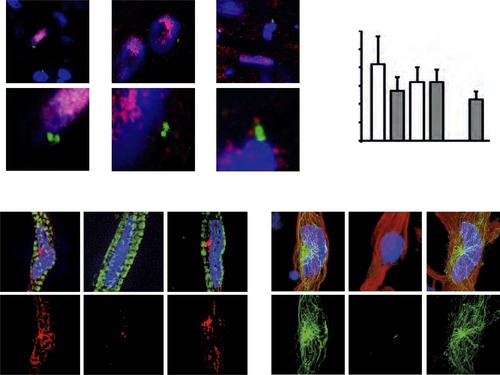
(A) Representative images of centrosomes (γ-tubulin) in heart cryosections of adult transgenic cmlc2:dsRedExp-nuchsc4 zebrafish, of adult newt hearts, and adult mouse hearts. Nuclei: DAPI, cardiac nuclei: DsRed or Nkx2.5. Green-framed expansions: newt and zebrafish cardiomyocyte nuclei with paired-centrioles. Yellow-framed expansion: mouse non-myocyte nucleus with paired-centrioles. White asterisk: cardiomyocyte nucleus. Yellow scale bar: 10 µm. Red scale bar: 2 µm. (B) Quantitative analysis of nuclei associated with intact centrosomes in cryosections as shown in (A). Data are mean ± SD, n = 3, e 300 cells were analyzed per experimental condition, *: p < 0.05. (C) Representative images documenting localization of microtubule regrowth (β-tubulin) in cultured adult zebrafish (Troponin I) and newt (phalloidin-TRITC) cardiomyocytes. Adult zebrafish were treated with serum (control), nocodazole, or nocodazole followed by wash out. Adult newt cardiomyocytes were treated with serum (control), ice, or ice followed by return to normal (norm) temperature. Nuclei: DAPI. Yellow arrowheads: localization of centrosome. Yellow scale bar: 10 µm. |
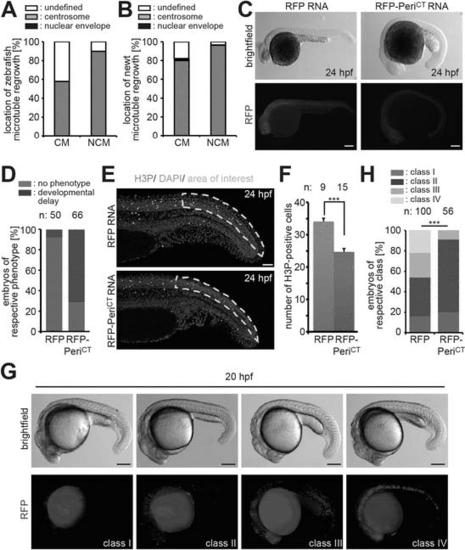
(A) Frequency of MTOC localization in adult zebrafish cardiomyocytes (CM) and non-myocytes (NCM) after nocodazole wash out. Cardiomyocytes from 12 hearts were pooled and 50 CMs and 50 NCMs were analyzed. (B) Frequency of MTOC localization in adult newt CM and NCM after microtubule depolymerization with ice. Cardiomyocytes from 10 hearts were pooled and > 50 CMs and > 50 NCMs were analyzed. (C) Expression of dominant negative Pericentrin (RFP-PeriCT) via RNA injection caused developmental delay in zebrafish embryos at 24 hr post fertilization (hpf) compared to RFP RNA-injected control embryos. (D) Percentage of embryos showing a normal or developmental delayed phenotype in each group. (E) Representative images of RFP and RFP-PeriCT RNA-injected zebrafish embryos stained for mitotic cells (H3P). (F) Quantification of H3P events in the area of interest as defined in (E). (G) Representative images of clone classes in RFP DNA-injected embryos at 20 hpf. (H) Percentages of embryos in different classes in RFP or RFP-PeriCT DNA-injected embryos. Data are mean ± SEM; n = total number of embryos analyzed. ***: p < 0.001. Scale bars: yellow/black: 250 µm; white: 50 µm. |