- Title
-
Mutagenesis Screen Identifies agtpbp1 and eps15L1 as Essential for T lymphocyte Development in Zebrafish
- Authors
- Seiler, C., Gebhart, N., Zhang, Y., Shinton, S.A., Li, Y.S., Ross, N.L., Liu, X., Li, Q., Bilbee, A.N., Varshney, G.K., LaFave, M.C., Burgess, S.M., Balciuniene, J., Balciunas, D., Hardy, R.R., Kappes, D.J., Wiest, D.L., Rhodes, J.
- Source
- Full text @ PLoS One
|
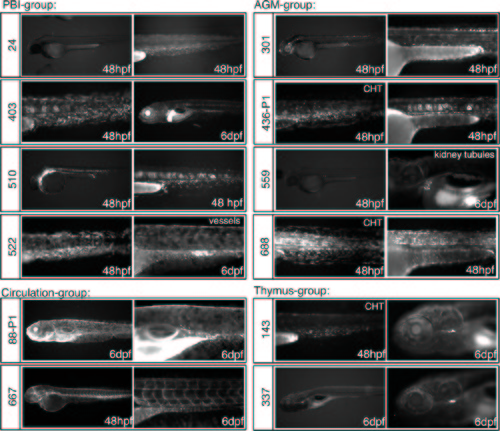
Patterns of GFP expression in GBT-B4 gene trap lines that include hematopoietic tissues. Lateral views of embryos at 48 hpf or 6 dpf are shown. The Tg(GBT-B4)fcc line number is indicated to the left of the panels. The embryo age is indicated. CHT = caudal hematopoietic tissue; AGM = aorta-gonad-mesonephros. Note that the lines are grouped by hematopoietic expression patterns, but the embryos can express GFP in additional tissues. |
|
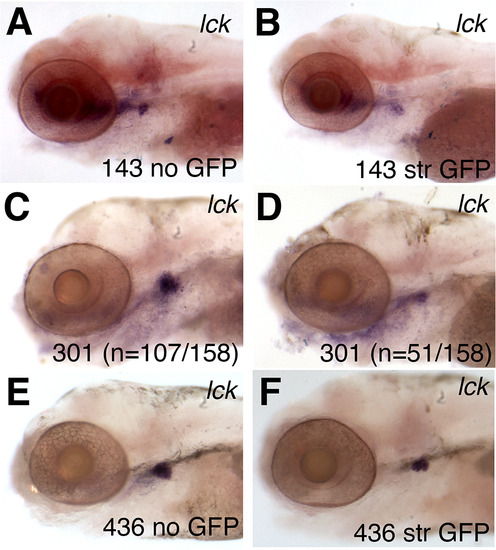
Decreased expression of lymphoid markers in gene-trap mutant embryos. (A-F) Whole mount RNA in situ hybridization (WISH) of lck in 5 dpf larvae from the lines fcc143 (143) (A-B), agtpbp1fcc301 (301) (C-D) and eps15L1fcc436-P1 (436) (E-F). Representative embryos displaying no GFP (A, E) or normal expression of lck (C) are compared to siblings with strong (str) GFP (B, F) or low levels of lck expression (D). In line agtpbp1fcc301, the GFP expression levels varied, making it difficult to distinguish heterozygous and homozygous carriers. The number of embryos that showed the representative phenotype is indicated in panels C and D. |
|
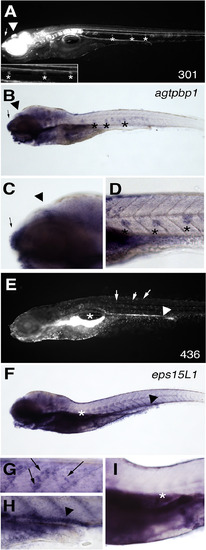
Endogenous gene expression matches the gene-trap GFP expression pattern for agtpbp1 and eps15L1 lines. (A) The GFP pattern in a representative 6 dpf embryo from the agtpbp1fcc301 line. (B-D) WISH of agtpbp1 at 6 dpf. Lateral line cells (*), epiphysis (arrowhead) and nasal pit (arrow) are indicated. (C-D) Magnified views of regions of the embryo shown in B. (E) The GFP pattern in a representative 6 dpf embryo from line eps15L1fcc436. (F-I) WISH of eps15L1 at 6 dpf. Pancreas (under *), kidney (arrowhead) and skin cells (arrows) are indicated. (G-I) Magnified views of regions of the embryo shown in F. EXPRESSION / LABELING:
|
|
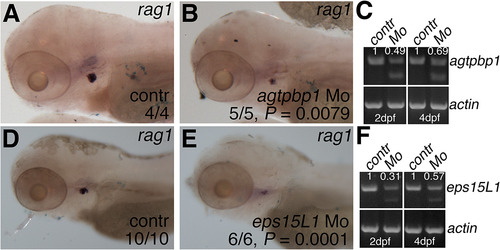
Morpholino knockdown of agtpbp1 and eps15L1 results in decreased lymphoid rag1 expression. (A-B) WISH of rag1 in 4 dpf control (A) and agtpbp1 (B) morpholino-injected embryos. (C) RT-PCR of agtpbp1 and β-actin in pooled control or morphant embryo samples. Quantitation of the normal transcript band normalized to ß-actin is indicated. (D-E) WISH of rag1 in 4 dpf control (A) and eps15L1 (B) morpholino-injected embryos. (C) RT-PCR of eps15L1 and ß-actin in pooled control or morphant embryo samples. Quantitation of the normal transcript band normalized to β-actin is indicated. Quantitation is in arbitrary units (A.U.), and relative to wild-type level which is set at 1. Head region of the embryos is shown in lateral views, anterior to the left. P values were determined using Fisher’s exact test. |
|
Confocal analysis of the localization of gene-trap GFP+ cells compared to transgenic (tg) rag2:mCherry lymphoid cells. (A) GFP+ cells in the thymus of 6 dpf line fcc143 embryos are distinct from, and surround, rag2:mCherry lymphoid cells. (B) Coexpression of line fcc337 GFP with transgene rag2:mCherry in a thymus of 6 dpf embryos. Yellow color = coexpression. |
|
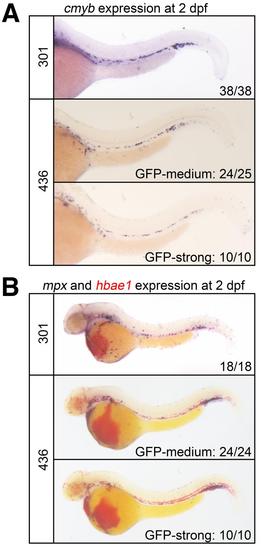
Normal emergence of definitive progenitor cells and primitive myeloid and erythroid cells in agtpbp1fcc301Gt/Tg(GBT-B4)fcc301 and eps15L1fcc436-P1Gt/Tg(GBT-B4)fcc436-P1 mutant embryos. (A) WISH of cmyb in 2 dpf embryos siblings from lines fcc 301 (top) and 436 (middle and bottom). There was no difference in the cmyb patterns between siblings. (B) WISH of mpx and hbae1 (in red) in 2 dpf embryos siblings from lines fcc 301 (top) and 436 (middle and bottom). There was no difference in the expression patterns between siblings. The number of siblings that display the representative phenotype is indicated in the panels. |
|
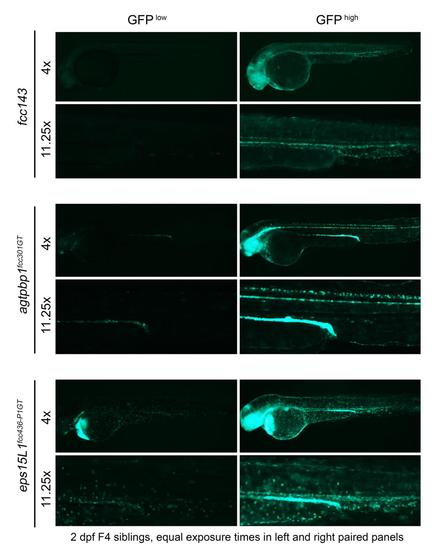
Comparison of GFP expression levels in fcc143, agtpbp1 and eps15L1 gene-trap lines. Images of representative 2 dpf siblings displaying low and high levels of GFP were acquired using the same exposure parameters for a given magnification. |
|
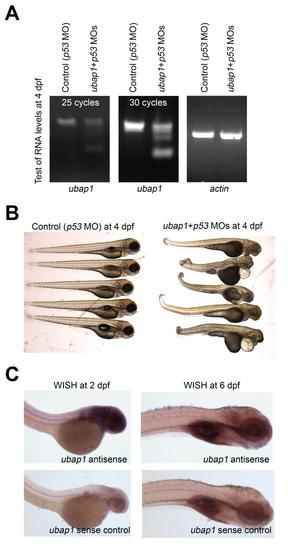
Evidence that ubap1 is not the gene-trap target in line fcc143. (A) RT-PCR analysis of ubap1 and actin expression in control and ubap1 morphants co-injected with p53 morpholino. (B) Brightfield images of groups of control and ubap1 morphants. Ubap1 morphants display widespread developmental defects, unlike fcc143 GFP-high embryos (see Fig 4B). (C) WISH of ubap1 antisense and sense probes in 2 and 6 dpf embryos. Ubap1 expression, shown by the antisense probe, was not detected in the caudal hematopoietic tissue or thymus in contrast to the GFP pattern in fcc143 carriers (see Fig 2). |
|
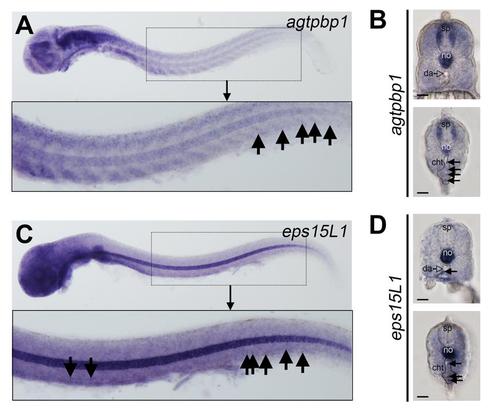
Whole mount expression analysis of agtpbp1 and eps15L1. (A-D) WISH of the indicated genes in 2 dpf embryos. (A) Agtpbp1 expression is shown in purple. Image shows a lateral view of a representative embryo, anterior facing left. Embryo was deyolked. The boxed area is enlarged in the lower panel. Black arrows indicate agtpbp1-expressing cells in the caudal hematopoietic tissue (CHT). (B) Transverse sections through the trunk (top panel) and tail (bottom panel) regions to show agtpbp1 expression in a 2-dpf embryo. Black arrows in the lower panel indicate positive cells in the CHT. (C) Eps15L1 expression is shown in purple. Image shows a lateral view of a representative embryo, anterior facing left. Embryo was deyolked. The boxed area is enlarged in the lower panel. Black arrows indicate positive cells in the AGM and CHT. (D) Transverse sections through the trunk (top panel) and tail (bottom panel) regions to show eps15L1 WISH analysis in a 2-dpf embryo. Black arrows indicate positive cells in the ventral wall of the dorsal aorta (da; AGM region) and CHT in the top and bottom panels, respectively. sp = spinal cord, no = notochord, da = dorsal aorta, cht = caudal hematopoietic tissue region. |
|
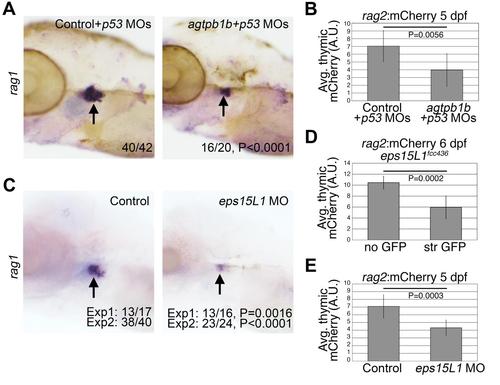
Deficiency for agtpbp1 and eps15L1 inhibits lymphoid development. (A) WISH of rag1 in 5 dpf control and agtpbp1 morphants co-injected with p53 morpholino. N is indicated. Images show lateral views of the left side of the head. Arrows indicate rag1-expressing cells in the thymus. (B) Levels of rag2:mCherry transgene expression in the thymus of 5 dpf control and agtpbp1 morphants. Images of mCherry (B,D,E) in siblings were acquired using identical exposure settings. Fiji was used to quantify the whole mount expression from the acquired images (shown in S10 Fig). (C) WISH of rag1 in 5 dpf control and eps15L1 morphants. N is indicated. Two independent experiments were performed. Images show lateral views of the left side of the head. Arrows indicate rag1-expressing cells in the thymus. (D-E) Quantitation of the rag2:mCherry transgene expression in the thymus in lines eps15L1fcc436-P1 (436) siblings at 6dpf (D) and control and eps15L1 morphants at 5 dpf (E). P values for mCherry quantitation were determined using two-tailed Student’s T-test; P values for WISH were determined using Fisher’s exact test. |
|
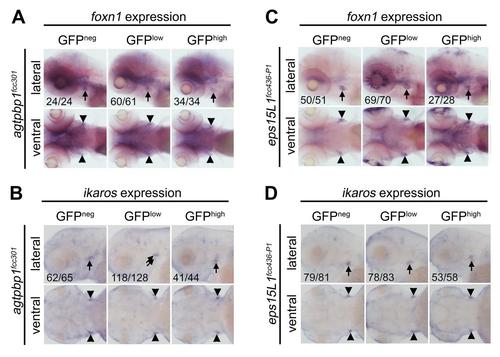
Agtpbp1 and eps15L1 mutants display normal thymic foxn1 and ikaros expression patterns. (A) WISH of foxn1 in 5 dpf agtpbp1fcc301 siblings sorted prior to fixation by their level of GFP expression, although there was a range of GFP expression levels in this line. (B) WISH of ikaros in 3 dpf agtpbp1fcc301 siblings separated prior to fixation based on their GFP expression level. (C) WISH of foxn1 in 5 dpf eps15L11fcc436-P1 siblings displaying the indicated GFP expression level. (D) WISH of ikaros in 3 dpf eps15L11fcc436-P1 siblings sorted prior to fixation by their level of GFP expression. Orientation, GFP expression levels and N are indicated. Neg = negative. Black arrows/arrowheads indicate WISH+ cells in the thymus. |

ZFIN is incorporating published figure images and captions as part of an ongoing project. Figures from some publications have not yet been curated, or are not available for display because of copyright restrictions. |

