
- Title
-
The wound inflammatory response exacerbates growth of pre-neoplastic cells and progression to cancer
- Authors
- Antonio, N., Bønnelykke-Behrndtz, M.L., Ward, L.C., Collin, J., Christensen, I.J., Steiniche, T., Schmidt, H., Feng, Y., Martin, P.
- Source
- Full text @ EMBO J.
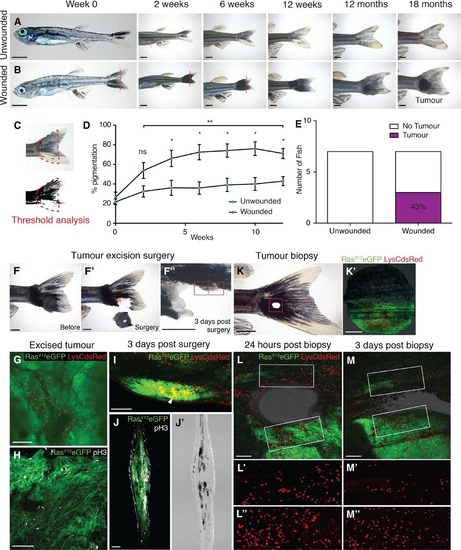
Tumours arise at sites of injury. A. Unwounded 4weekold kita:RasG12VeGFP juvenile fish followed over time. B. Juvenile kita:RasG12VeGFP fish wounded by tailfin resection (red line) every 2 weeks for 12 weeks. C. Pigmentation of the tail fin as quantified by threshold analysis of the tail area (indicated by red dotted line) at each time point. D. Graph illustrating the percent pigmentation over 12 weeks (mean ± SEM). E. Number of tail fin tumours developed in wounded versus unwounded fish (n = 7 fish in unwounded and wounded group, respectively). F–F′′ An adult kita:RasG12VeGFP fish with a large tail melanoma prior to surgery (F), immediately after (F′) and 3 days postsurgery (F′′); the surgery left a small section of melanoma remaining on the ventral tail fin (highlighted by the red box). G. Wholemount immunohistochemistry of the excised unwounded tumour stained for LysC (red) to reveal neutrophils. H. Immunohistochemistry of a section of the same excised tumour stained for phosphohistone H3 (pH3, white) to reveal the extent of proliferation. I. Wholemount immunohistochemistry of the tail with wounded tumour remnant 3 days postsurgery (green) illustrating accumulation of neutrophils (red) within the wounded tumour tissue (arrowhead). J, J′ A frozen section through the tail with wounded tumour remnant 3 days postsurgery (plane indicated by red dotted line in F′′) stained for phosphoH3 revealing how proliferating cells (white) appear to have increased in number in the remaining tumour. Equivalent brightfield section shown in (J′). K, K′ An adult kita:RasG12VeGFP; p53+/-; LysC:dsRed fish with an earlystage, flat, tail melanoma just postpunch biopsy at the tumour margin; punch biopsy tissue with green RasG12VeGFP tissue adjacent to healthy tissue is shown in (K′). L–L′′ Multichannel view of the repairing wound illustrating how, 24 h postwounding, neutrophils (red) have been drawn to both tumour and healthy tissue wound edge. (L) and (L′′) are magnifications of the wound edges of nontumour and tumour tissue, respectively. M–M′′ Multichannel view of the repairing wound at 3 days postwounding, demonstrating that neutrophils have largely resolved away from the wound site in healthy tissue (M′) but remain highly concentrated in wounded tumour tissue (M′′). PHENOTYPE:
|
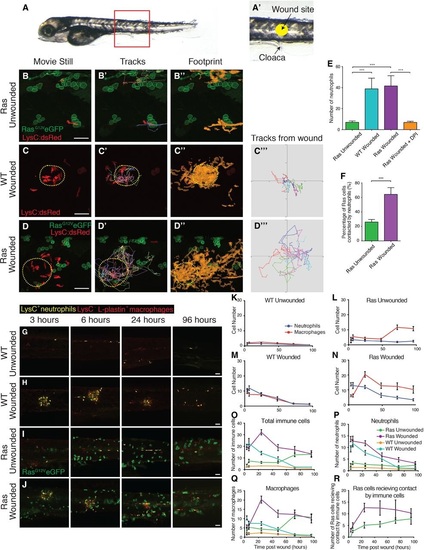
Live imaging reveals neutrophils distracted away from wounds due to competing signals from adjacent pre-neoplastic cells. A, A′ Fivedays postfertilisation larva illustrating the region of flank where we image and wound (A). Wounds (yellow circle) are made in the centre of the flank just above the cloaca (arrow) in all larval experiments (A′). B–B′′ Stills from a timelapse movie of a larva with RasG12VeGFP preneoplastic cell clones but no wound. C–C′′′ Equivalent timelapse stills of a control, laserwounded larva with no preneoplastic cell clones at 90 min postwounding (wound indicated with yellow dotted line). D–D′′′ Stills from a timelapse movie of a larva with RasG12VeGFP preneoplastic cell clones (green), again wounded 90 min before. E. Graph comparing the number of LysC:dsRed+ neutrophils recruited over a 2h period to the equivalent flank region of unwounded RasG12VeGFP larvae (n = 11), versus wounded WT larvae (n = 3), wounded RasG12VeGFP larvae (n = 5) and wounded RasG12VeGFP larvae treated with DPI inhibitor (n = 7). ***P d 0.001. F. Graph comparing the percentage of Ras+ preneoplastic cells that receive contacts with neutrophils during the 2h period of the movie in unwounded (n = 11) versus wounded (n = 5) larvae. ***P d 0.001. G–J Unwounded WT sibling; LysC:dsRed+ larva (n = 10 per time point) for comparison of clone growth with (H) laserwounded WT sibling: LysC:dsRed+ larva (n = 15 per time point), (I) unwounded Ras+; LysC:dsRed+ larvae (n = 15 per time point) and (J) laserwounded Ras+; LysC:dsRed+ (n = 20 per time point). Larvae were harvested and fixed between 3 dpf and 7 dpf (i.e. between 3 and 96 h postwounding), and stained with antiLplastin and antiRFP antibodies to distinguish neutrophils (yellow) and macrophages (red). K–N Graphs showing the numbers of neutrophils and macrophages in the flanks of unwounded WT siblings (K), unwounded Ras+ larvae (L), wounded WT siblings (M) and wounded Ras+ larvae (N). O–Q Graphs indicating the total number of innate immune cells (O), macrophages (P) and neutrophils (Q) recruited over time in wounded and unwounded WT and unwounded and wounded Ras+ larvae. R. Graph showing the number of preneoplastic cells receiving contact by immune cells in unwounded/wounded larvae over time (P = 0.0052 for 5 days postwound). EXPRESSION / LABELING:
PHENOTYPE:
|
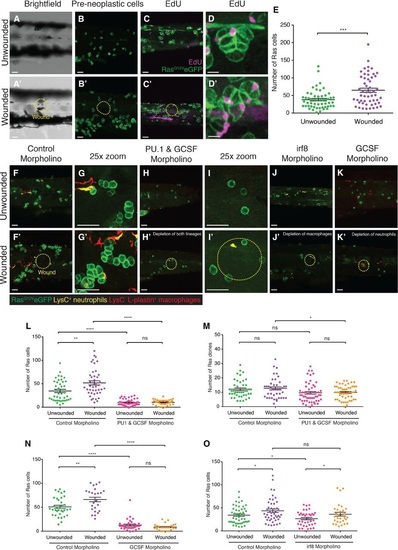
Wounding leads to increased proliferation of pre-neoplastic cells. A–D′ RasG12VeGFP larvae were left unwounded (A–D) or laserwounded (yellow dotted line) at 2 dpf just dorsal to the cloaca (A′–D′). Larvae were left to grow for 3 days before being fixed and analysed for preneoplastic cell number (n = 30 larvae in each group). EdU accumulation (purple) is shown at low magnification (C and C′) and a representative preneoplastic cell clone is shown (D and D′). E. Graph illustrating preneoplastic cell numbers in unwounded versus wounded larvae (n = 27 of each group). Data from three independent experiments showed the same level of significance. ***P d 0.001. F–G′ Images of larvae injected with control morpholino at the onecell stage, and either left unwounded (F, high magnification: G) or laserwounded at 3 dpf (F′, high magnification: G′) and fixed at 5 dpf. H–J′ Larvae injected with a combination of PU1 and GCSF morpholinos at the onecell stage, left unwounded (H, high magnification: I) or laserwounded at 3 dpf (H′, high magnification: I′) and fixed at 5 dpf. Images of larvae injected with irf8 morpholino, and either unwounded (J) or laserwounded at 3 dpf (J′) before subsequent fixation at 5 dpf. K, K′ Larvae injected with GCSF morpholino, and either left unwounded (K) or laserwounded at 3 dpf (K′) and fixed at 5 dpf. L, M Graphs to show the total number of Ras+ cells and clones (respectively) at 5 dpf after PU1 and GCSF morpholinos. N, O Graphs showing the number of Ras+ cells at 5 dpf after irf8 morpholino (N) or after GCSF morpholino injection (O). |
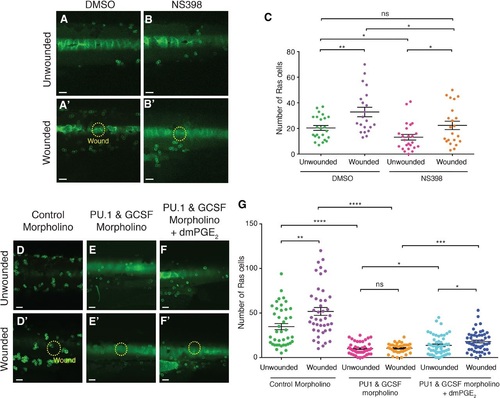
PGE2 is one component of the trophic signal driving woundinflammationtriggered preneoplastic cell proliferation A–B′ Images of Ras+ larval flanks from control fish bathed in Danieau′s solution or with 10 µM NS398 to block Cox2 enzyme activity, and left unwounded (A, B) or laserwounded (A′, B′) at 3 dpf before subsequent fixation at 5 dpf. C. Graph showing quantification of preneoplastic cell numbers at 5 dpf from (A–B′) (n = 15–20 larvae in each group). D, D′ Unwounded control Ras+ larvae (D) versus sibling larvae that have been laserwounded at 2 dpf (D′). E–F′ Unwounded versus wounded larvae after injection with PU1 and GCSF morpholinos (E and E′), and addition of 20 µM dmPGE2 (F and F′). G. Graph showing preneoplastic cell numbers from (D–F′). |
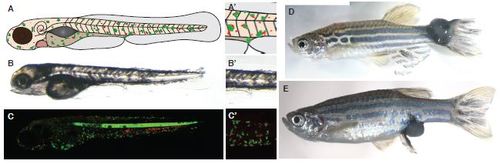
Standard larval model for studying immune cell:pre-neoplastic cell interactions. A. Schematic to illustrate the larval model, whereby oncogenic Human RasG12V is used to drive cell transformation in a tissue specific manner, in melanocytes and mucus-secreting goblet cells by a kit-a enhancer trap (ET30). B. DIC microscopy of a 5dpf kita:RasG12VeGFP zebrafish larvae. C. Confocal laser scanning microscopy image of a 5dpf kita:RasG12VeGFP; LysC:dsRed zebrafish larvae. (A′, B′, C′) Zoom in of the area around the cloaca to illustrate the region frequently imaged. D. and E Adult fish occasionally develop large pigmented tumours, particularly at exposed sites such as the ventral fin by the cloaca or tail. |
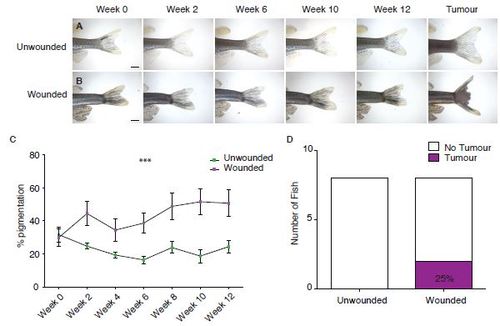
Wounding adult fish leads to tumour development. A. Unwounded 3-6 month old kita:RasG12VeGFP fish followed over time. B. 3-6 month old kita:RasG12VeGFP fish wounded by tail-fin resection every 2 weeks for 12 weeks. Scale bars represent 2mm (A-B). C. Graph to illustrate the % pigmentation over 12 weeks. D. Number of tail fin tumours developed in wounded versus unwounded fish (n = 8 fish in unwounded and wounded group respectively). |
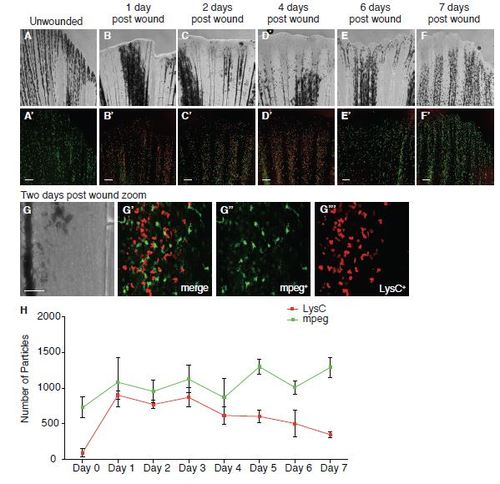
Timecourse of leukocyte recruitment to adult fin wounds. A-F Adult zebrafish were analysed for inflammatory cell recruitment by resecting a small portion of the caudal tail fin. Three 6 month old LysC:dsRed; mpeg:FRET fish were fixed each day post wounding and whole-mount immuno-stained for LysC+ neutrophils (red) and mpeg+ macrophages (green) for seven days post wounding. G-G′′′ A zoom in of immune cell recruitment at two days post wound (C) is shown in panel. H- Neutrophil and macrophage recruitment is quantified, calculated by the number of particles counted automatically in ImageJ. Scale bars represent 150µm (A-F and J-O) and 50µm (G). |
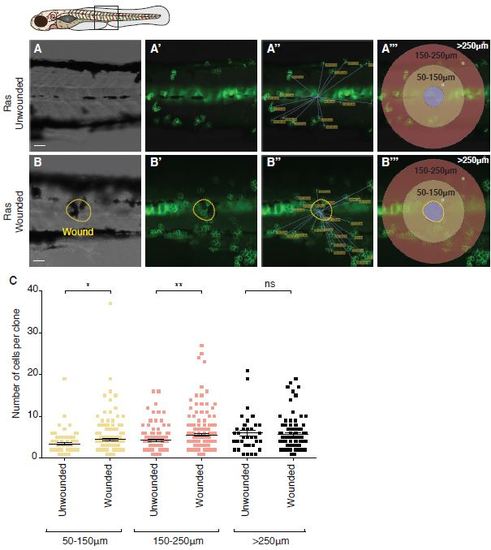
Clone size increases in a zone extending up to 250µm from the wound centre. A-B RasG12VeGFP larvae were left unwounded (A) or laser wounded (B) at 2dpf just dorsal to the urogenital opening. Larvae were left to grow for 3 days before being fixed and analysed for pre-neoplastic cell number (n=30 larvae in each group). (A′′ and B′′) show the analysis performed to measure the distance from a clone to the centre of the wound. (A′′′ and B′′′) show the boundaries of, 50-150µm, 150-250µm and >250 µm which were used to define clone location, as plotted in (C). The approximate domain for imaging is indicated by a box in the schematic. Scale bars represent 50µm. |
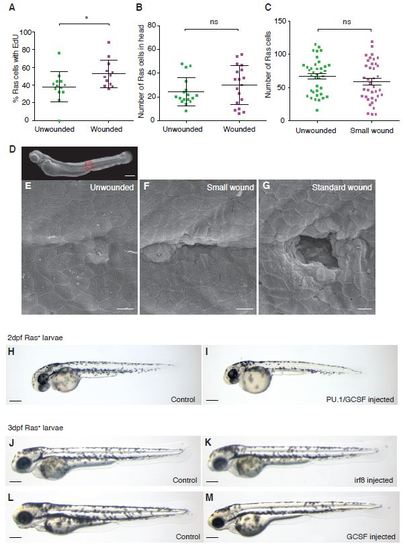
Only large wounds trigger proliferation in nearby pre-neoplastic cells. A. Graph showing the percentage of EdU positive pre-neoplastic cells in unwounded versus wounded larvae. B. The number of pre-neoplastic cells distant from the wound site (in the larval head) is unchanged between wounded and unwounded larvae. C. Graph to show that small wounds (as shown in the SEM image, G) do not lead to increased proliferation. D. shows a whole zebrafish larvae with a box in red to indicate where high magnification pictures were taken of an unwounded 3dpf larvae (E), a small wound (F) where ablation is restricted to just one epithelial cell (although adjacent cells may also be affected), and a standard sized wound (G) which causes broader tissue damage across a diameter of 5-7 cells (i.e. >35µm). H-M Brightfield images of Ras+ larvae injected with control morpholino (H, J and L) PU-1/GCSF morpholino (I) irf8 morpholino (K) and GCSF morpholino (M) at 2 or 3dpf (labelled). Scale bars represent 200µm (D and H - M) and 10µm (E-G). |
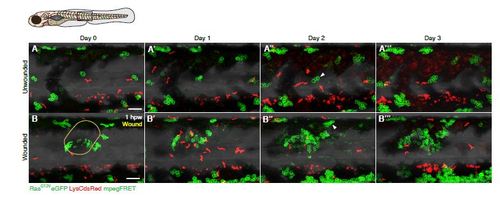
Timecourse of clonal growth in the presence versus absence of a wound. A-B A series of time-lapse images showing clonal growth in a wounded RasG12VeGFP LysCdsRed mpegFRET larva and unwounded control over a period of four consecutive days. (A) Control, unwounded larva, versus (B) Larva wounded at 4dpf. Arrowhead in (B′′) highlights a clone close to the wound, which has increased in size from two to seven cells over a 24 hour period. Over the same period, most clones in the control larva grow more slowly (arrowhead in A′′). The approximate domain for imaging is indicated by a box in the schematic. Scale bars represent 100µm. |