
- Title
-
TopBP1 Governs Hematopoietic Stem/Progenitor Cells Survival in Zebrafish Definitive Hematopoiesis
- Authors
- Gao, L., Li, D., Ma, K., Zhang, W., Xu, T., Fu, C., Jing, C., Jia, X., Wu, S., Sun, X., Dong, M., Deng, M., Chen, Y., Zhu, W., Peng, J., Wan, F., Zhou, Y., Zon, L.I., Pan, W.
- Source
- Full text @ PLoS Genet.
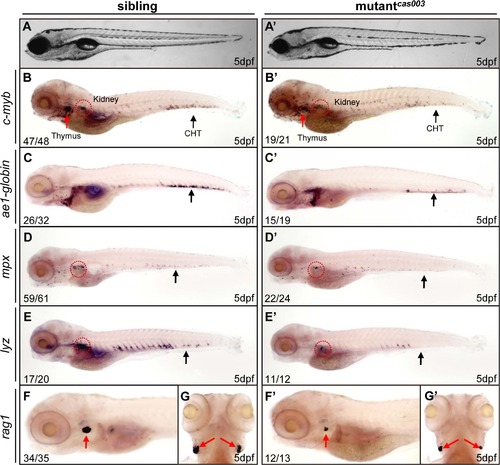
The definitive hematopoiesis is defective in zebrafish mutantcas003 embryos. (A, A′) The bright field images of zebrafish wild-type sibling (A) and mutantcas003 embryos (A′) showing no obvious difference at 5dpf. (B-G′) Whole-mount in situ hybridization (WISH) results of c-myb, ae1-globin, mpx, lyz and rag1 showing defective definitive hematopoiesis in mutantcas003 embryos (B′-G′) but not in sibling embryos (B-G) at 5dpf. The penetrance of the indicated phenotype is shown in the bottom left of each panel. (B-F, B′-F′) Lateral views; (G, G′) dorsal views. Black arrows indicate the position of caudal hematopoietic tissue (CHT); red arrows and circles show the position of thymus and kidney, respectively. |
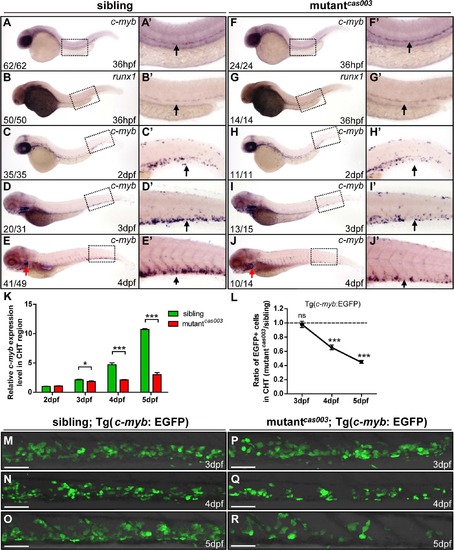
The number of HSPCs is reduced in the mutantcas003 CHT. (A-J′) The time-course analysis of definitive HSPCs from 36hpf to 4dpf by WISH with c-myb (A, A′, C-E′, F, F′, H-J′) or runx1 (B, B′, G, G′) indicating the HSPCs are decreased from 3dpf in mutantcas003 embryos comparing to siblings. The penetrance of the indicated phenotype is shown in the bottom left of each panel. (A′-J′) Enlarged views of AGM or CHT regions indicated by the dotted rectangles in the left columns. Black arrows represent the AGM (A′, B′, F′, G′) or CHT (C′-E′, H′-J′); red arrows indicate the thymus. (K) Quantitative PCR analysis of c-myb expression level in the tail region from 2dpf to 5dpf showing the attenuated c-myb expression after 3dpf in mutantcas003 embryos comparing to siblings. Error bars represent SEM. *, p<0.05; ***, p<0.001. (L-R) Immunofluorescence stain of EGFP in the CHT region in mutantcas003; Tg(c-myb: EGFP) embryos (P-R) and siblings (M-O) from 3dpf to 5dpf. The statistics result of the ratio of EGFP+ cell number in the CHT region of mutantcas003 embryos to that in the siblings is indicated in L (n>6 embryos are counted in each panel). These results indicate that EGFP+ HSPCs begin to be decreased obviously in CHT region in mutantcas003 embryos comparing to siblings from 4dpf. Scale bars represent 50µm. Error bars represent SEM; ns, no significance; *** represents p<0.001. PHENOTYPE:
|
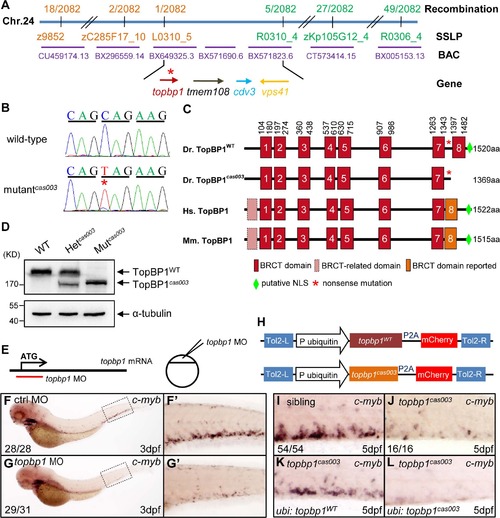
The topbp1 gene is disrupted in mutantcas003. (A) Positional cloning of mutantcas003. Bulk segregation analysis (BSA) revealed that the mutation occurred on chromosome 24 (Chr. 24). After high-resolution mapping with SSLPs, the point mutation was flanked by SSLP markers L0310_5 (1 recombinant out of 2082 meiosis) and R0310_4 (5 recombinants out of 2082 meiosis). This region contains four genes including topbp1, tmem108, cdv3 and vps41. The blue line represents Chr. 24; the positions and the recombinations of the SSLP markers on Chr. 24 or BACs are indicated. The SSLP markers which are on the same side of the mutation site are shown in the same color. (B) The coding region of topbp1 was sequenced in the wild-type sibling (top) and mutantcas003 (bottom). There is a C to T mutation in the mutantcas003 embryos, which is a nonsense mutation. (C) Comparison of vertebrate TopBP1 and zebrafish TopBP1cas003. As human TopBP1 (Hs. TopBP1) and mice TopBP1 (Mm. TopBP1), zebrafish TopBP1WT (Dr. TopBP1) contains eight BRCT domains, while the eighth BRCT domain and putative nuclear localization signal (NLS) is missing in TopBP1cas003 due to the nonsense mutation (*). The red and pink BRCT domains were predicted by SMART software. The orange BRCT domains were reported previously. The molecular sizes of the protein are indicated in the right side. (D) Western blotting analysis showing reduced protein size of TopBP1cas003. (E-G′) Topbp1 morphants can phenocopy topbp1cas003. (E) Topbp1 MO can block the translation of topbp1 mRNA. The topbp1 MO, as validated in S3 Fig, was injected into one-cell stage wild-type embryos to produce topbp1 morphants. (F-G′) WISH results of c-myb in the control morphants (F, F′) and topbp1 morphants (G, G′) at 3dpf. topbp1 morphants show decreased c-myb expression. (F′, G′) The enlarged views of the dotted rectangle region in the left columns. The penetrance of the indicated phenotype is shown in the bottom left of each panel. (H) Construction of the plasmids used in Tol2-transposease-mediated rescue assays. topbp1WT and topbp1cas003 driven by the ubiquitin promoter, followed by the P2A peptide and the mCherry coding sequence, are cloned into Tol2 transposon vector. These constructs are abbreviated as ubi: topbp1WT and ubi: topbp1cas003 respectively. (I-L) WISH analysis with c-myb probe in the CHT region (at 5dpf) of sibling, topbp1cas003 mutant and topbp1cas003 mutant with transient transgenesis of ubi: topbp1WT or ubi: topbp1cas003. 28 embryos out of 45 topbp1cas003 mutants were rescued by topbp1WT, but none by topbp1cas003 (n = 14). EXPRESSION / LABELING:
|
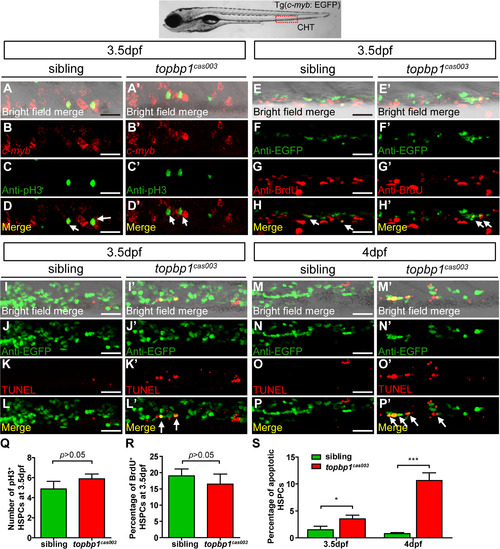
The defect of definitive hematopoiesis is due to the increased apoptosis in the HSPCs of topbp1cas003 mutants. (A-D′) The c-myb in situ hybridization and phospho-histone H3 (pH3) immunostaining at 3.5dpf in sibling and topbp1cas003 mutant embryos, indicating no significant difference in the number of pH3+ HSPCs (pH3 and c-myb double positive cells, white arrows) between wild-type sibling and topbp1cas003 mutant embryos. The images show the stain in the enlarged CHT region. Scale bars represent 25µm. (E-H′) Double immunostaining of c-myb: EGFP and BrdU at 3.5dpf in the sibling and topbp1cas003 mutant embryos. The number of BrdU+ HSPCs (BrdU and EGFP double positive cells, white arrows) in topbp1cas003 mutant embryos is comparable to that in wild-type siblings. Scale bars represent 25µm. (I-P′) Double immunostaining of c-myb: EGFP and TUNEL at 3.5dpf (I-L′) and 4dpf (M-P′) in the sibling and topbp1cas003 mutant embryos. The apoptotic HSPCs (TUNEL and EGFP double positive cells, white arrows) are increased in the topbp1cas003 mutants comparing to siblings, which is more profound at 4dpf. Scale bars represent 25µm. (Q) Quantification of the number of the pH3+ HSPCs in sibling and topbp1cas003 mutant embryos at 3.5dpf. (R) Statistics result of the percentage of BrdU+ HSPCs at 3.5dpf. (Q) and (R) indicate no significant difference in the number of proliferating HSPCs between topbp1cas003 mutant embryos and siblings at 3.5dpf. (S) Quantitative analysis of apoptotic HSPCs in the CHT region in sibling and topbp1cas003 mutant embryos at 3.5dpf and 4dpf, showing the increased apoptotic HSPCs in the topbp1cas003 mutant embryos. For the Quantitative analysis, at least 6 embryos were analysis for each experimental group. Error bars represent SEM. *, p<0.05; ***, p<0.001. EXPRESSION / LABELING:
PHENOTYPE:
|
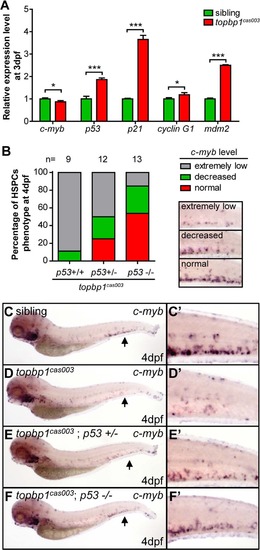
The apoptosis of HSPCs is p53 dependent in topbp1cas003 mutants. (A) Quantitative PCR results of c-myb, p53, p21, cyclin G1 and mdm2 in the CHT region of wild-type sibling and topbp1cas003 mutant embryos at 3dpf. All these p53 dependent apoptosis-related genes are upregulated. Error bars represent SEM. *, p<0.05; ***, p<0.001. (B) Quantitative analysis of HSPCs phenotype, monitored by c-myb WISH analysis, showing inactivation of p53 can partially rescue c-myb expression in topbp1cas003 mutants. The 3 kinds of standards of c-myb WISH results in the CHT at 4dpf are shown in the right bottom. The numbers of embryos are shown above the columns. (C-F′) c-myb WISH analysis of siblings, topbp1cas003, topbp1cas003; p53+/- and topbp1cas003; p53-/- embryos at 4dpf, which are quantified in B. E and E′ represent partially rescued embryos; F and F′ represent well rescued embryos. (C-D′, C-D′) 23/25 siblings and 8/9 topbp1cas003 mutants show indicated phenotype. (C′-F′) Enlarged views of CHT region indicated by arrows in the left column. EXPRESSION / LABELING:
|
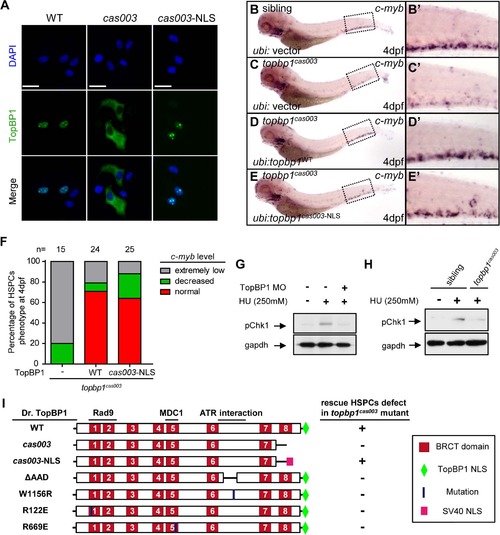
Subcellular mislocalization and defective ATR/Chk1 activation link to defects in HSPCs in the topbp1cas003 mutants. (A) Confocal imaging analysis of anti-FLAG immunostaining (green) and DAPI (blue) in HeLa cells transfected with FLAG tagged TopBP1WT (WT), TopBP1cas003 (cas003) and TopBP1cas003-NLS (cas003-NLS). TopBP1WT is mainly localized in the nucleus (left column), cytosol mislocalization of TopBP1cas003 (middle column) can be corrected by the additional SV40 NLS on its C-terminus (TopBP1cas003-NLS, right column). Scale bars represent 25 µm. (B-F) WISH analysis of hematopoiesis in siblings and topbp1cas003 mutant embryos with Tol2-transposase mediated topbp1WT and topbp1cas003-NLS transgenesis at 4dpf, which are quantified in F (the numbers of embryos are shown above). Defective c-myb expression in topbp1cas003 mutants can be rescued by topbp1cas003–NLS as well as topbp1WT. (B-C, B′-C′) 28/32 siblings and 12/15 topbp1cas003 mutants show indicated WISH results. (D-E, D′-E′) WISH results of well rescued mutants. (B′-E′) Enlarged views of CHT region in the left column. (G) Western blot with pChk1 antibody in control morphants and hydroxyurea (HU) treated control or topbp1 morphants. The morphants were treated with 250mM HU or mock from 60hpf to 76hpf. topbp1 knockdown could abrogate the Chk1 phosphorylation in the tail region upon HU treatment. (H) Immunoblotting analysis showing reduced phospho-Chk1 level in tail region of topbp1cas003 mutants upon HU treatment, comparing to that in wild-type siblings. The embryos were treated with 250mM HU or mock from 60hpf to 76hpf. (I) Schematic diagram of variant forms of TopBP1, including wild-type (WT), cas003, cas003-NLS, ΔAAD, W1156R, R122E and R669E mutation. The regions associated with ATR activation and Rad9 or MDC1 interactions are indicated. After Tol2-mediated transient transgenesis of variant forms of TopBP1 into topbp1cas003 mutant embryos, quantitative analysis of the c-myb expression in the CHT region at 4dpf was performed for the evaluation of rescue capability (n>20). "+" (rescue); "-" (not rescue effect). Except WT and cas003-NLS, all TopBP1 mutation forms are unable to rescue hematopoietic defects in topbp1cas003 mutants. |
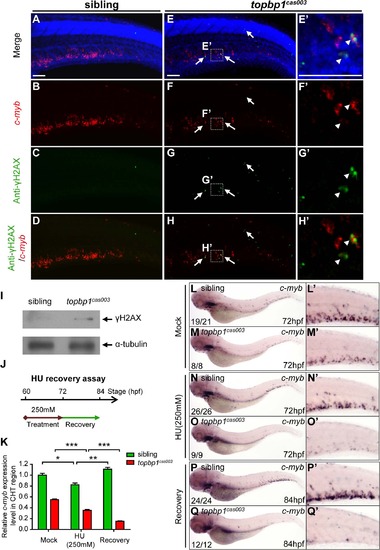
topbp1cas003 mutants manifest deficient DNA damage repair capability. (A-H′) Immuno-staining of γH2AX (green), c-myb fluorescent in situ hybridization (red) and DAPI stain (blue) in sibling and topbp1cas003 mutant embryos at 3.5dpf. (E′-H′) Magnified views of the regions in the dashed boxes showing γH2AX+; c-myb+; DAPI+ cell in the CHT region. Arrows indicate the γH2AX+; DAPI+ cells. The γH2AX+; DAPI+ cells are increased in topbp1cas003 mutants comparing to siblings. Moreover, γH2AX+; c-myb+; DAPI+ cells can only be detected in topbp1cas003 mutants (H′). Scale bars represent 50µm. (I) Immunoblotting showing increased γH2AX level in the CHT of topbp1cas003 mutant embryos at 3dpf. (J) Procedure of the hydroxyurea (HU) recovery assay. Brown arrow line represents 250mM HU or mock treatment from 60hpf to 72hpf; green arrow line indicates removal of HU or mock treatment from 72hpf to 84hpf for recovery. (K-Q) The c-myb expression is further decreased in topbp1cas003 mutant embryos under HU treatment. Wild-type siblings or topbp1cas003 mutant embryos, after 12-hours mock treatment or after 12-hours 250mM HU treatment and sequential 12-hours recovery, were analyzed by either quantitative PCR (K) or c-myb WISH analysis (L-Q). c-myb level can be recovered in wild-type siblings, but not in topbp1cas003 mutant embryos. The penetrance of the indicated phenotype is shown in the bottom left of each panel. Error bars represent SEM. * p<0.05; ** p<0.01; *** p<0.001. (L′-Q′) Enlarged views of the CHT region of embryos in the left columns. EXPRESSION / LABELING:
|
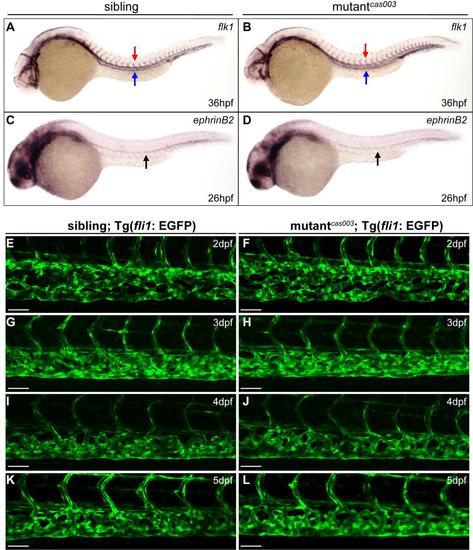
The vascular system is normal in mutantcas003 embryos. (A, B) WISH results of flk1 at 36hpf in sibling and mutantcas003 embryos. All the embryos (n = 47) show the same flk1 expression pattern. Red arrows indicate the dorsal aorta (DA); blue arrows indicate the posterior cardinal vein (PCV). (C, D) WISH results of ephrinB2 at 26hpf in sibling and mutantcas003 embryos. All the embryos (n = 36) show the same ephrinB2 expression pattern. Arrows indicate the DA. The expression of flk1 and ephrinB2 in mutantcas003 embryos is comparable to that in siblings. (E-L) Live imaging of vascular plexus in the CHT region of sibling and mutantcas003 embryos within Tg(fli1: EGFP) background from 2dpf to 5dpf. The vascular niche of HSPCs is normal in mutantcas003. For each panel, at least 6 embryos were observed. Scale bars represent 50 µm. |
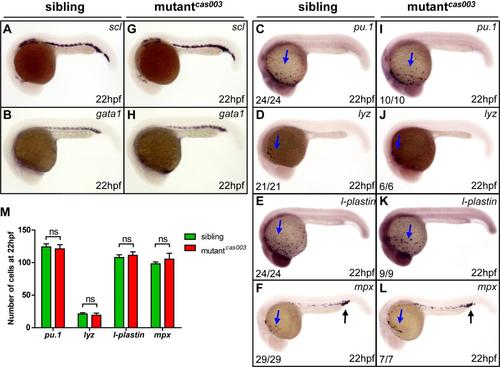
The primitive hematopoiesis is undisturbed in mutantcas003. (A-L) WISH results showing normal expression of scl, gata1, pu.1, lyz, l-plastin and mpx at 22hpf in mutantcas003 embryos comparing to siblings. Total numbers of embryos with scl or gata1 stain are 56 and 76, respectively. The penetrance of the indicated phenotype is shown in the bottom left of each panel in C-L. Blue arrows indicate the myeloid cells in the yolk sac; black arrows indicate the granulocytes in the posterior blood island (PBI). (M)Quantitative analysis of pu.1+, lyz+, l-plastin+ and mpx+ cell numbers showing no significant difference between sibling and mutantcas003 embryos at 22hpf. Error bars represent SEM. ns represents no significance. |
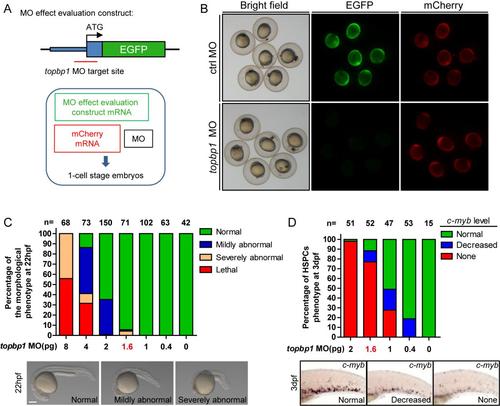
The topbp1 morphants can phenocopy mutantcas003 embryos in a dose-dependent manner. (A) Diagram of topbp1 MO knockdown effect evaluation construct. EGFP coding region was fused in frame to the 3′ end of a DNA fragment (blue boxes) containing topbp1 ATG MO targeting site (red line). This construct was in vitro transcripted, and then co-injected with mCherry mRNA (50pg) and topbp1 MO (1pg) or control MO (1pg) into 1-cell stage embryos. (B) Fluorescence of the 9hpf embryos in the topbp1 knockdown effect evaluation assay. topbp1 MO (upper), instead of control MO (down), can knockdown the expression of EGFP without affecting mCherry fluorescence. Left column, bright field; middle column, EGFP; right column, mCherry. (C) Quantitation of 22hpf morphology of the wild-type embryos injected with a gradient dose of topbp1 MO. Injection with more than 1.6pg topbp1 MO can induce abnormal morphogenesis. (D) Quantitation of the c-myb WISH analysis of embryos injected with a gradient dose of topbp1 MO at 3dpf. The topbp1 morphants can phenocopy topbp1cas003 mutants with 1.6–2 pg injection dosage without causing morphological defect. |
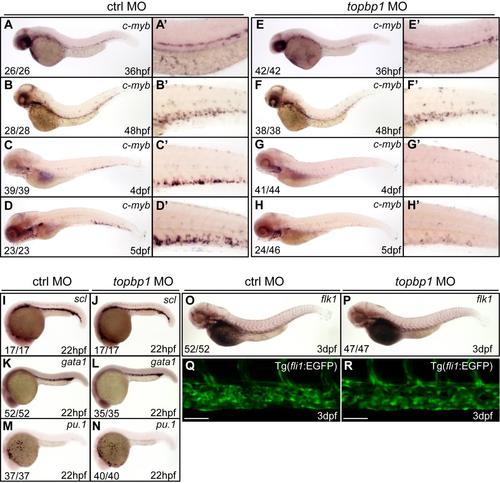
The HSPC formation, primitive hematopoiesis and vascular morphogenesis are normal in topbp1 morphants. (A-H′) Time-course analysis of c-myb expression in control and topbp1 morphants (1.6pg MO) from 36hpf to 5dpf. In topbp1 morphants, the c-myb expression is normal at 36hpf and 48hpf, but is decreased at 4dpf and 5dpf. The penetrance of the indicated phenotype is shown in the bottom left of each panel. (A′-H′) Enlarged detail of c-myb WISH analysis in the CHT region. (I-P) WISH analysis of scl, gata1 and pu.1 at 22hpf, or flk1 at 3dpf in control and topbp1 morphants (1.6pg MO). The primitive hematopoiesis and vascular system are normal in topbp1 morphants. (Q-R) Live imaging analysis of vascular plexus in the CHT region in control or topbp1 morphants within Tg(fli1: EGFP) background at 3dpf. The vascular plexus is normal in topbp1 morphants. Scale bars represent 50µm. |
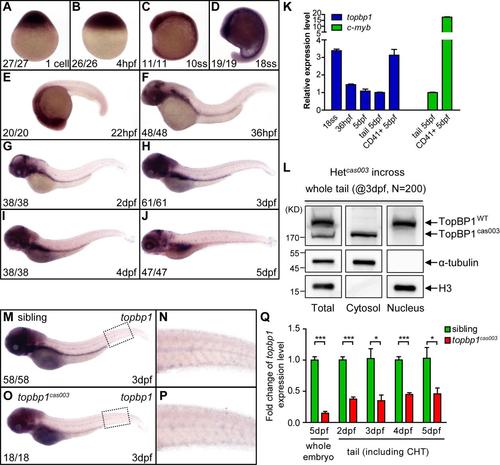
The topbp1 gene is ubiquitously expressed in the development. (A-J) WISH results of topbp1 from 1-cell stage to 5dpf showing global expression of topbp1. ss, somites. The penetrance of the indicated phenotype is shown in the bottom left of each panel. (K) Quantitation of topbp1 in the whole embryos, tails and sorted CD41+ cells at the indicated stage. topbp1 is 3-fold enriched in CD41+ cells within the tail region of Tg(CD41: EGFP) line at 5dpf, demonstrating the expression of topbp1 in HSPCs. c-myb is used as a positive control. (L) Western blotting analysis on endogenous TopBP1WT/TopBP1cas003 protein in cytoplasmic and nuclear fractions of pooled 3dpf embryos from heterozygotes incrossing. TopBP1WT localized in nucleus, but TopBP1cas003 localized in cytosol. (M-P) WISH analysis of topbp1 in sibling and topbp1cas003 mutant embryos at 3dpf. The expression of topbp1 is decreased in mutant, especially in cranial region. (N, P) Enlarged detail of c-myb WISH analysis in CHT region. (Q) Quantitative PCR analysis on the topbp1 mRNA level in the whole embryos at 5dpf or the tails including CHT from 2dpf to 5dpf. The expression level of topbp1 is decreased in the topbp1cas003 mutants. Error bars represent SEM; * represents p<0.05; *** represents p<0.001. |
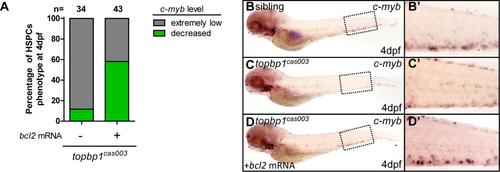
Bcl2 overexpression can rescue hematopoietic failure in topbp1cas003 mutants. (A) Quantitative analysis of HSPCs phenotype, monitored by c-myb WISH, in topbp1cas003 mutants with or without bcl2 mRNA injection. bcl2 mRNA could significantly rescue c-myb expression in topbp1cas003 mutants. The number of the mutant embryos (n) is indicated above each column. (B-D′) WISH of c-myb in sibling, topbp1cas003 mutants and mutants injected with bcl2 mRNA at 4dpf. The proportion of the rescued c-myb phenotype shown in D is 25 out of 43 mutant embryos. (B′-D′) Enlarged views of the CHT representing the dashed boxes region in the left column. |
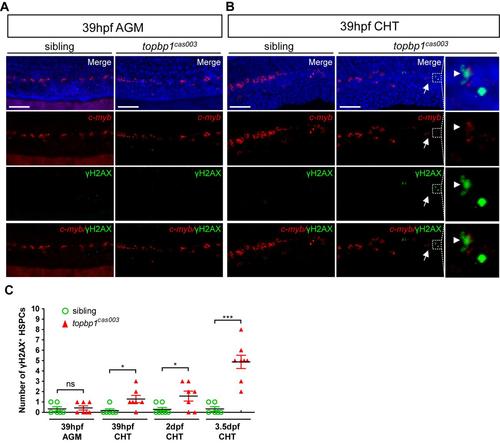
DNA damage is accumulated in HSPCs in the CHT region of topbp1cas003 mutants. (A-B) Triple staining of γH2AX antibody, c-myb fluorescent in situ hybridization and DAPI in topbp1cas003 mutants and siblings at 39hpf. The triple staining results show that the γH2AX+ HSPCs, which are undetectable in the AGM region in both mutants and siblings (A), are increased in the CHT region of topbp1cas003 mutants at 39hpf (B). The right columns in B are the magnified views of the dashed boxes in the middle columns. Scale bars represent 50um. (C) Quantification of γH2AX+ HSPCs in the AGM or CHT region in topbp1cas003 mutants and siblings at 39hpf, 2dpf and 3.5dpf. The number of γH2AX+ HSPCs is increased in the CHT region in the mutants from 39hpf to 3.5dpf. Error bars represent SEM. ns, no significance; *, p<0.05; ***, p<0.001. |
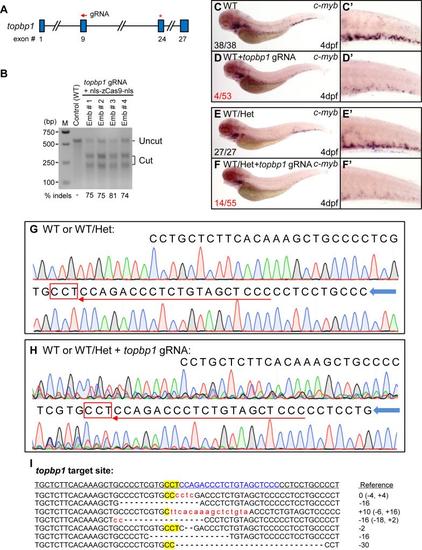
Biallelic disruption of topbp1 by CRISP/Cas9 mimics HSPCs deficiency in topbp1cas003 mutant. (A) Diagram showing the target site of topbp1 gRNA used in this study. The topbp1 gene contains 27 exons. Five gRNAs targeting exon 6, 7 and 9 of topbp1 were designed. The indicated gRNA targeting exon 9 with high mutagenesis rates was used for the following assay. Arrow indicates the target site of the gRNA. Red asterisk represents the position of nonsense mutation in topbp1cas003 mutant. (B) T7 endonuclease I (T7EI) assay showing the mutagenesis efficacy in topbp1 gRNA targeted embryos. topbp1 gRNA (25pg) and nls-zCas9-nls mRNA (150pg) were injected into the wild-type embryos. M, maker; Emb, embryo. (C-D′) The c-myb WISH results showing some of the Cas9 injected wild-type embryos manifested dramatically decreased c-myb expression as same as topbp1cas003 mutant at 4dpf (4/53). (E-F′) The c-myb WISH results showing the Cas9 injected WT/Het embryos displayed dramatically decreased c-myb expression at 4dpf (14/55). Het, topbp1cas003 heterozygote. WT/Het embryos were generated from outcross of topbp1cas003 heterozygote and wild-type fish (Efficiency of CRISPR/Cas9-mediated mutagenesis varies in different microinjection assay). (G-H) Genomic sequencing of the topbp1 gRNA targeting region in the WT or WT/Het embryos (G) and Cas9 injected embryos in D or F (H). Red boxes represent the protospacer-adjacent motif (PAM) site; red arrows indicate the orientation and target site of topbp1 gRNA; blue arrows show the orientation of sequencing. (I) Mutations in 7 out of 9 sequenced topbp1 alleles from a topbp1-targeted F0 embryo. The wild-type reference sequence is underlined. The target site is showed in blue; PAM is highlighted by yellow background. Deletions and insertions are indicated by dashes and lowercase red letters, respectively. The indel mutations are noted at the right of each sequence (+, insertion; , deletion). |
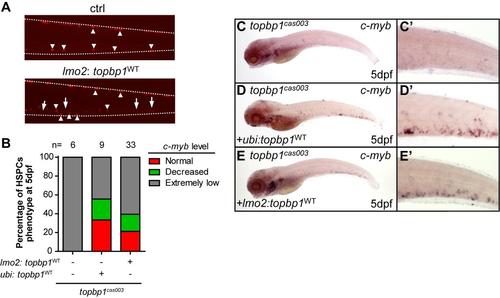
lmo2 promoter-induced ectopic expression of wild-type topbp1 can partially rescue HSPCs defect in topbp1cas003 mutant. (A) Fluorescence observation of embryos injected with lmo2: topbp1WT transient transgenesis construct. P2A-mCherry fragment was added after topbp1WT as an indicator. The mCherry positive cells could be detected in the CHT region at 5dpf in the injected embryos instead of non-injected embryos. Arrow heads represent the melanocytes; arrows indicate the mCherry+ cells. (B-E′) The c-myb WISH analysis of topbp1cas003 mutant embryos with ectopic expression of ubi: topbp1WT or lmo2: topbp1WT. Ectopic expression of lmo2: topbp1WTcould partially rescue the c-myb expression in topbp1cas003 mutants at 5dpf. (B) Quantitation of the rescue assay. (C′-E′) Enlarged views of the CHT regions in the left column. |
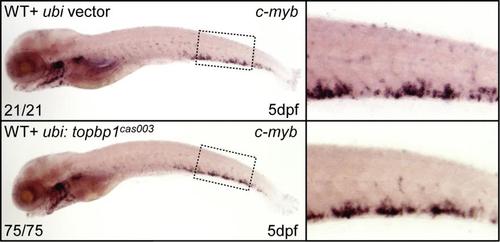
Ectopic expression of TopBP1cas003 does not cause hematopoietic failure. The c-myb WISH analysis of wild-type embryos injected with ubi: topbp1cas003 or control transient transgenesis constructs, showing no difference in definitive hematopoiesis at 5dpf. |