
- Title
-
Identification of the Mind Bomb1 Interaction Domain in Zebrafish DeltaD
- Authors
- Palardy, G., Chitnis, A.B.
- Source
- Full text @ PLoS One
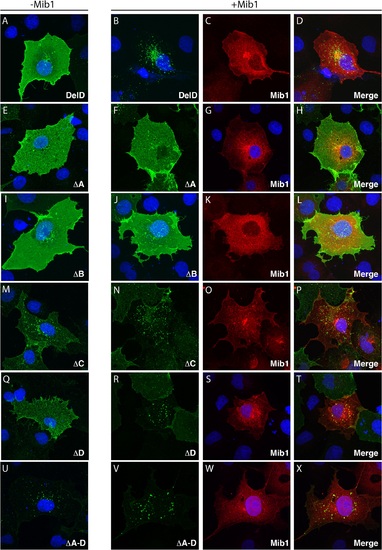
Endocytosis of DeltaD deletion mutants. (A,E,I,M,Q,U) Distribution of zdd2 (green) in COS7 cells transfected with DeltaD (A) or DeltaD ΔA, ΔB, ΔC, ΔD or ΔA-D deletion mutants (E, I, M, Q, U). Surface DeltaD was first labelled by incubation with zdd2 at 4°C for 30′ then, following washout of unbound zdd2, internalization was allowed for 30′ at 37°C. Nuclei were labelled with DAPI (blue). (B-D, F-H, J-L, N-P, R-T, V-X) Distribution of zdd2 (green) in COS7 cells co-transfected with DeltaD constructs and Mib1 (red) following internalization as described above. Each set of 3 panels, respectively, shows distribution of the DeltaD construct (green), Myc-Mib1 (red)/nuclei (blue), and the merged image. See materials and methods for details. |
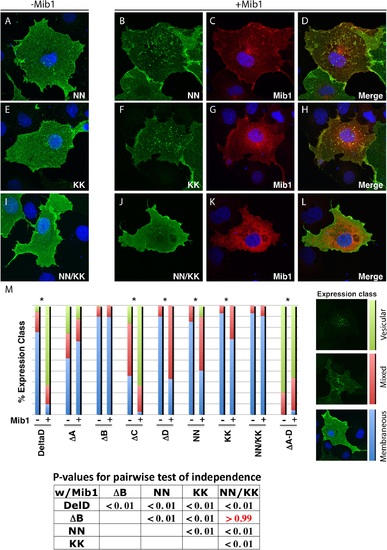
Endocytosis of DeltaD point mutants. Distribution of zdd2 (green) in COS7 cells transfected with DeltaD-NN (A), DeltaD-KK (E) and DeltaD-NN/KK following the internalization protocol described in Fig 3. Nuclei were labelled with DAPI (blue). Distribution of zdd2 (green) in COS7 cells co-transfected with DeltaD-NN (B-D), DeltaD-KK (F-H), DeltaD-NN/KK (J-L) and Mib1 following internalization as described above. Each set of 3 panels, respectively, shows distribution of the DeltaD construct (green), Myc-Mib1 (red)/nuclei (blue), and the merged image. (M) Summary of expression classes found in DeltaD full length, deletion and point mutants assayed following the internalization protocol described above. P-values for pairwise comparison based on Fisher’s Exact test of independence. P >. 05 does not meet the criteria for the Null hypothesis that pairs contain an equivalent distribution of expression classes. |
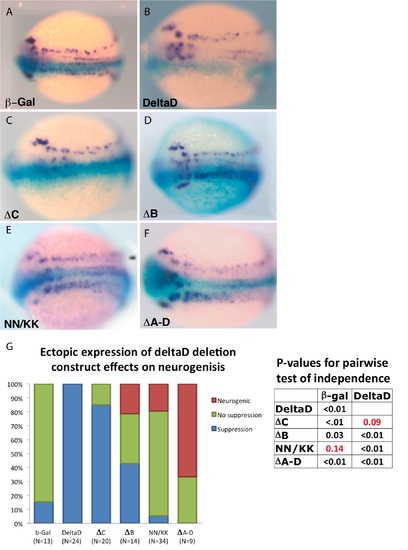
Ectopic expression of deltaD deletion and point mutant recapitulates neurogenic phenotype of DeltaD (ΔA-D). (A) The prospective distribution of neurons revealed by the distribution of huC as revealed by in situ hybridization probe (purple) in control embryos injected with only β-galactosidase mRNA. (B-F) huC in embryos co-injected with β-galactosidase and deltaD (B), deltaD-C (C), deltaD B (D), deltaD NN/KK (E) or DeltaD ΔA-D (F) mRNA. Distribution of ectopic mRNA injected in one cell at the two-cell stage revealed by X-Gal distribution (blue). Dorsal view, rostral to the left. Embryos are at approximately the 3 somite stage. (G) Quantification of the effect of ectopic expression of mRNA encoding various forms of DeltaD on the distribution of early neurons. Red indicates fraction with a neurogenic phenotype (increased density of neurons), Green—fraction with no obvious effect on neuron density, Blue- fraction with suppression of neurogenesis (reduced neuron density). P-values for pairwise comparison based on Fisher’s Exact test of independence. P >. 05 does not meet the criteria for the Null hypothesis that pairs contain an equivalent distribution of phenotype classes. |